Fig. 3.
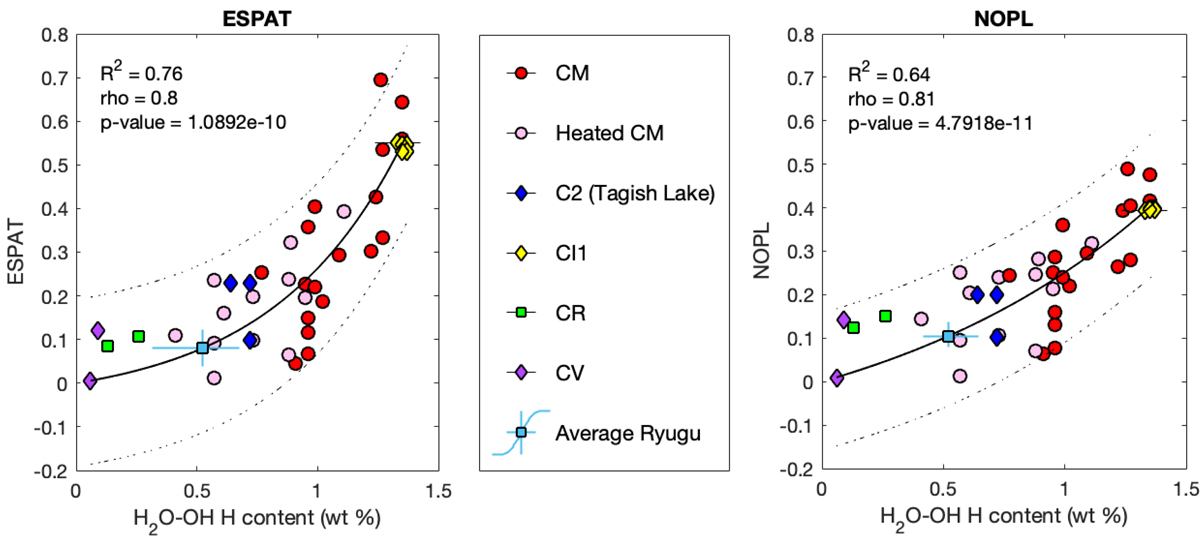
Exponential correlation between the meteorite H content (Appendix A) and its ESPAT parameter (left) and NOPL parameter (right), including different types of hydrated CC meteorites as well as Ryugu. Parameter errors for the meteorites are smaller than the symbols. The thick black line is the exponential regression of the meteorite data; the two dashed black lines define the prediction bounds, which indicate the area in which a new data point would fall with a 95% probability. The mean H content values for Ryugu, determined using the meteorite exponential correlations, are 0.52 wt.% in both cases. Ryugu H content relative variation (horizontal bars; 0.313 wt.%–0.675 wt.% using ESPAT and 0.415 wt.%–0.643 wt.% using NOPL) is computed using the minimum and maximum values of the ESPAT and NOPL spectral parameters (vertical bars), respectively.
Current usage metrics show cumulative count of Article Views (full-text article views including HTML views, PDF and ePub downloads, according to the available data) and Abstracts Views on Vision4Press platform.
Data correspond to usage on the plateform after 2015. The current usage metrics is available 48-96 hours after online publication and is updated daily on week days.
Initial download of the metrics may take a while.