Open Access
Fig. 1.
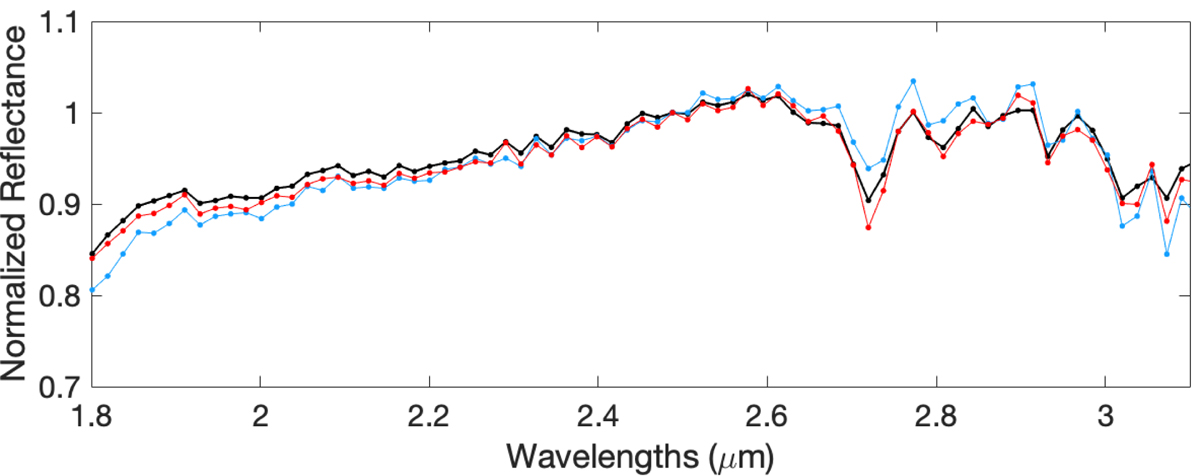
Average normalized (at 2.5 μm) Ryugu spectrum from July 19, 2018 (in black), and the spectra showing the deepest and shallowest 2.72 μm band depth (in red and blue, respectively), using a linear continuum from 2.60 to 2.90 μm.
Current usage metrics show cumulative count of Article Views (full-text article views including HTML views, PDF and ePub downloads, according to the available data) and Abstracts Views on Vision4Press platform.
Data correspond to usage on the plateform after 2015. The current usage metrics is available 48-96 hours after online publication and is updated daily on week days.
Initial download of the metrics may take a while.