Free Access
Fig. 4.
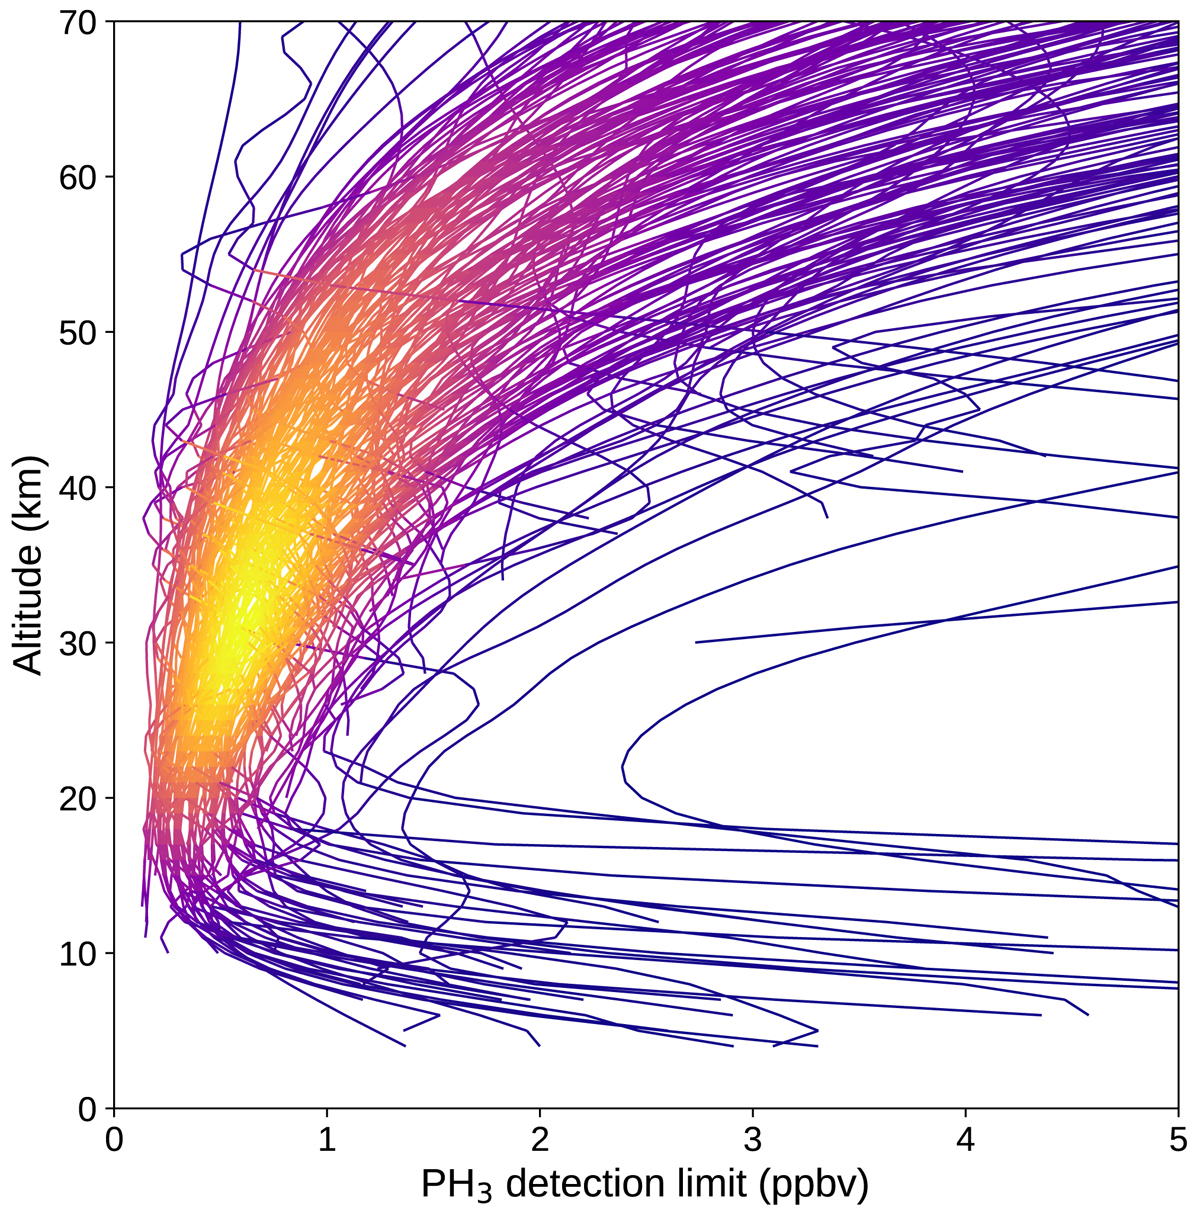
Vertical profiles of the standard error of the weighted mean for 192 ACS MIR solar occultations observed between Ls = 140–350° in MY 34 and 35. The lines are coloured by the Gaussian kernel density estimate for the entire dataset, with the highest density of data appearing as orange and yellow.
Current usage metrics show cumulative count of Article Views (full-text article views including HTML views, PDF and ePub downloads, according to the available data) and Abstracts Views on Vision4Press platform.
Data correspond to usage on the plateform after 2015. The current usage metrics is available 48-96 hours after online publication and is updated daily on week days.
Initial download of the metrics may take a while.