Free Access
Fig. 2.
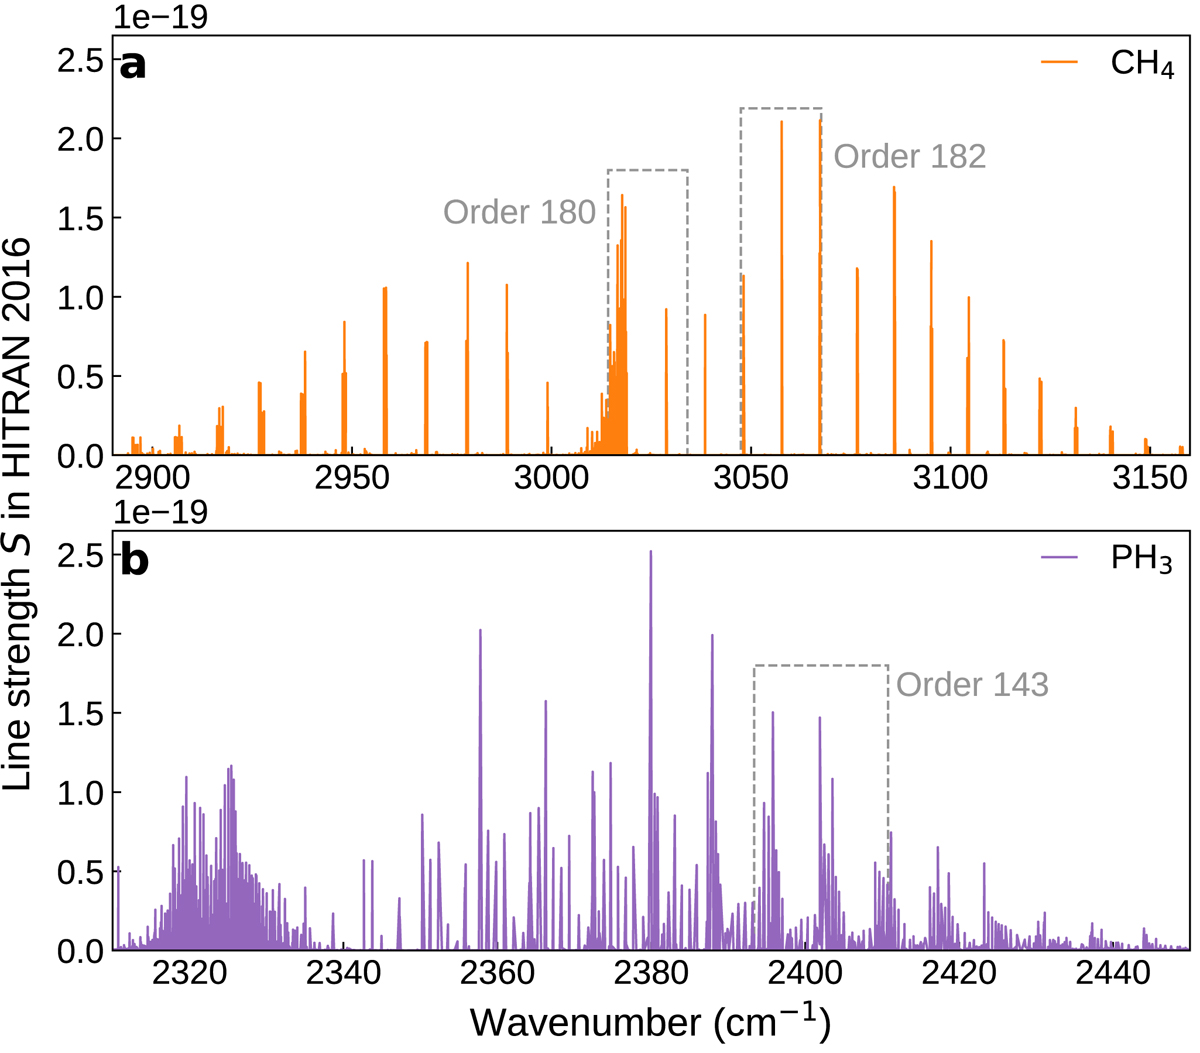
HITRAN 2016 line strengths for the ν3 vibration-rotation band of CH4 (panel a) and the ν3 vibration-rotation band of PH3 (panel b). The spectral ranges of important ACS MIR diffraction orders are indicated in grey.
Current usage metrics show cumulative count of Article Views (full-text article views including HTML views, PDF and ePub downloads, according to the available data) and Abstracts Views on Vision4Press platform.
Data correspond to usage on the plateform after 2015. The current usage metrics is available 48-96 hours after online publication and is updated daily on week days.
Initial download of the metrics may take a while.