Fig. 1.
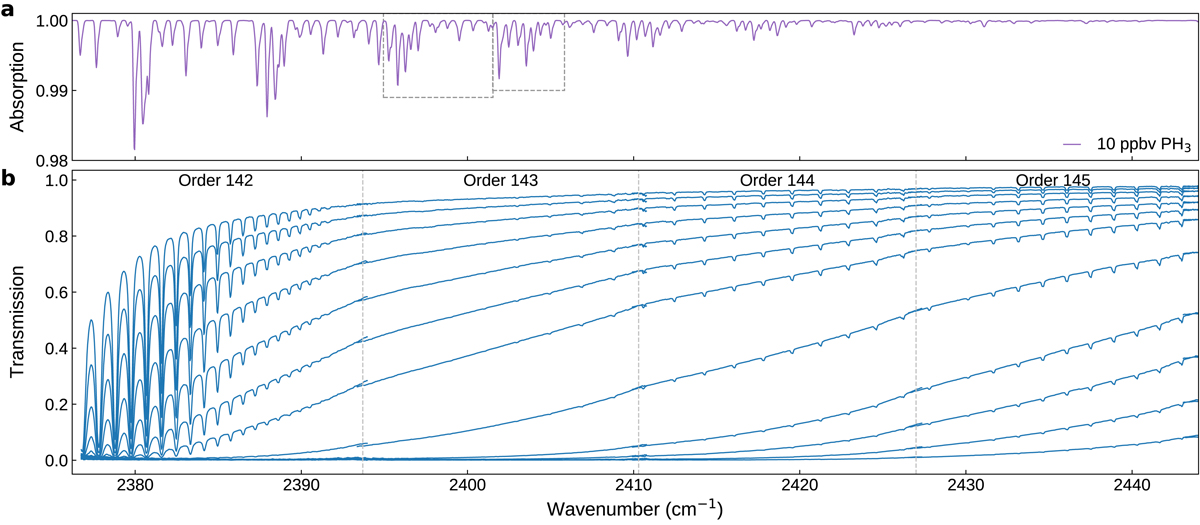
Spectral range of ACS MIR containing PH3 absorption features. Panel a: modelled transmission spectrum contributions from 10 ppbv of PH3 from a 20 km tangent height. Panel b: single spectra extracted from orders 142–145 for 12 consecutive tangent heights (2–26 km) in the lower atmosphere of Mars using ACS MIR secondary grating position 9. All visible absorption lines result from CO2, which also impacts the broad continuum that decreases transmission towards lower wavenumbers, where the CO2ν3 vibration-rotation band is centred. Boxes in panel a indicate the spectral windows covering PH3 absorption features in order 143 used to determine upper limits.
Current usage metrics show cumulative count of Article Views (full-text article views including HTML views, PDF and ePub downloads, according to the available data) and Abstracts Views on Vision4Press platform.
Data correspond to usage on the plateform after 2015. The current usage metrics is available 48-96 hours after online publication and is updated daily on week days.
Initial download of the metrics may take a while.