Fig. 2.
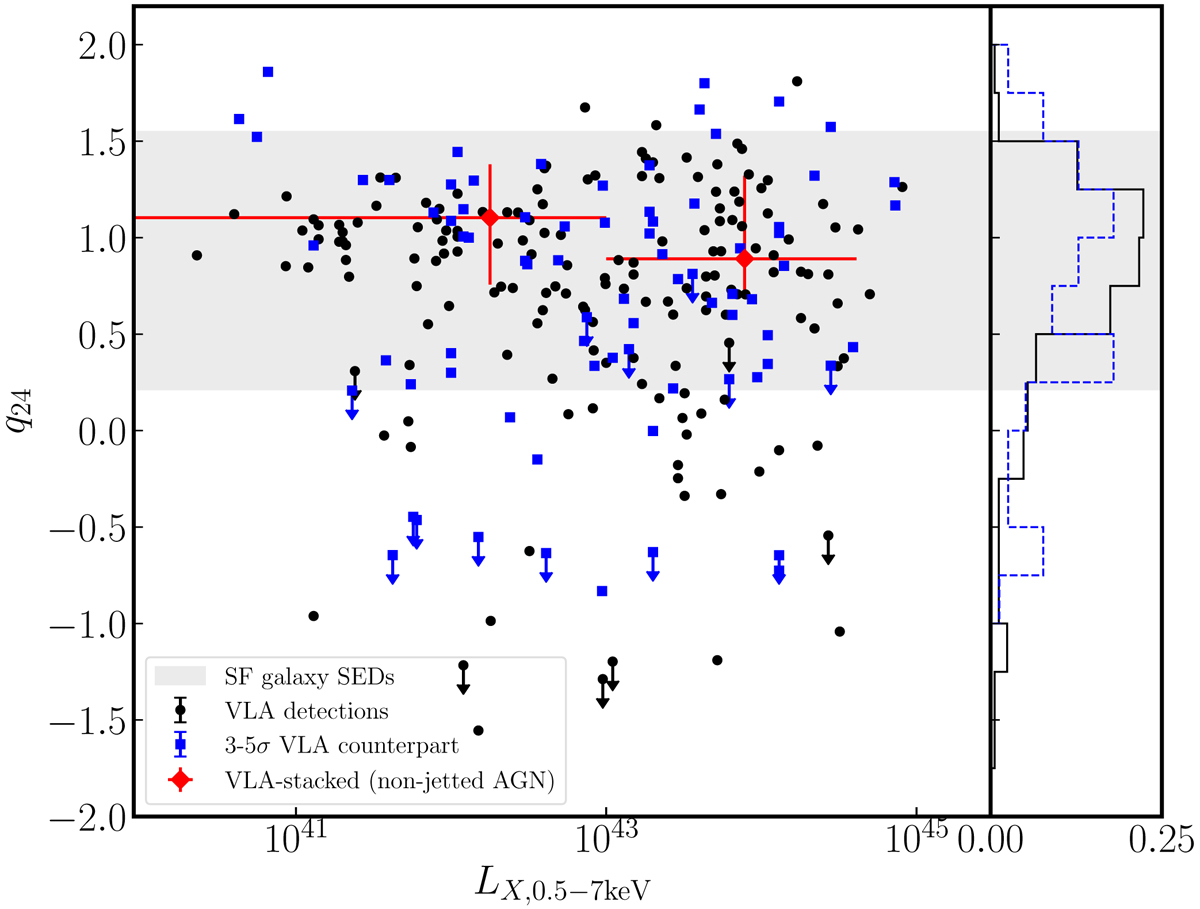
FIR/radio ratio, q24, as a function of the X-ray luminosity for three groups of X-ray AGN: > 5 sigma VLA detections (black), 3−5 sigma VLA detections (blue), and radio-undetected (red); the normalized frequency distributions appear at the right. The gray bar represents the range of q24 between redshifts of 0 ≤ z ≤ 3 for five star-forming galaxy templates (data acquired from Del Moro et al. 2013).
Current usage metrics show cumulative count of Article Views (full-text article views including HTML views, PDF and ePub downloads, according to the available data) and Abstracts Views on Vision4Press platform.
Data correspond to usage on the plateform after 2015. The current usage metrics is available 48-96 hours after online publication and is updated daily on week days.
Initial download of the metrics may take a while.