Fig. 2.
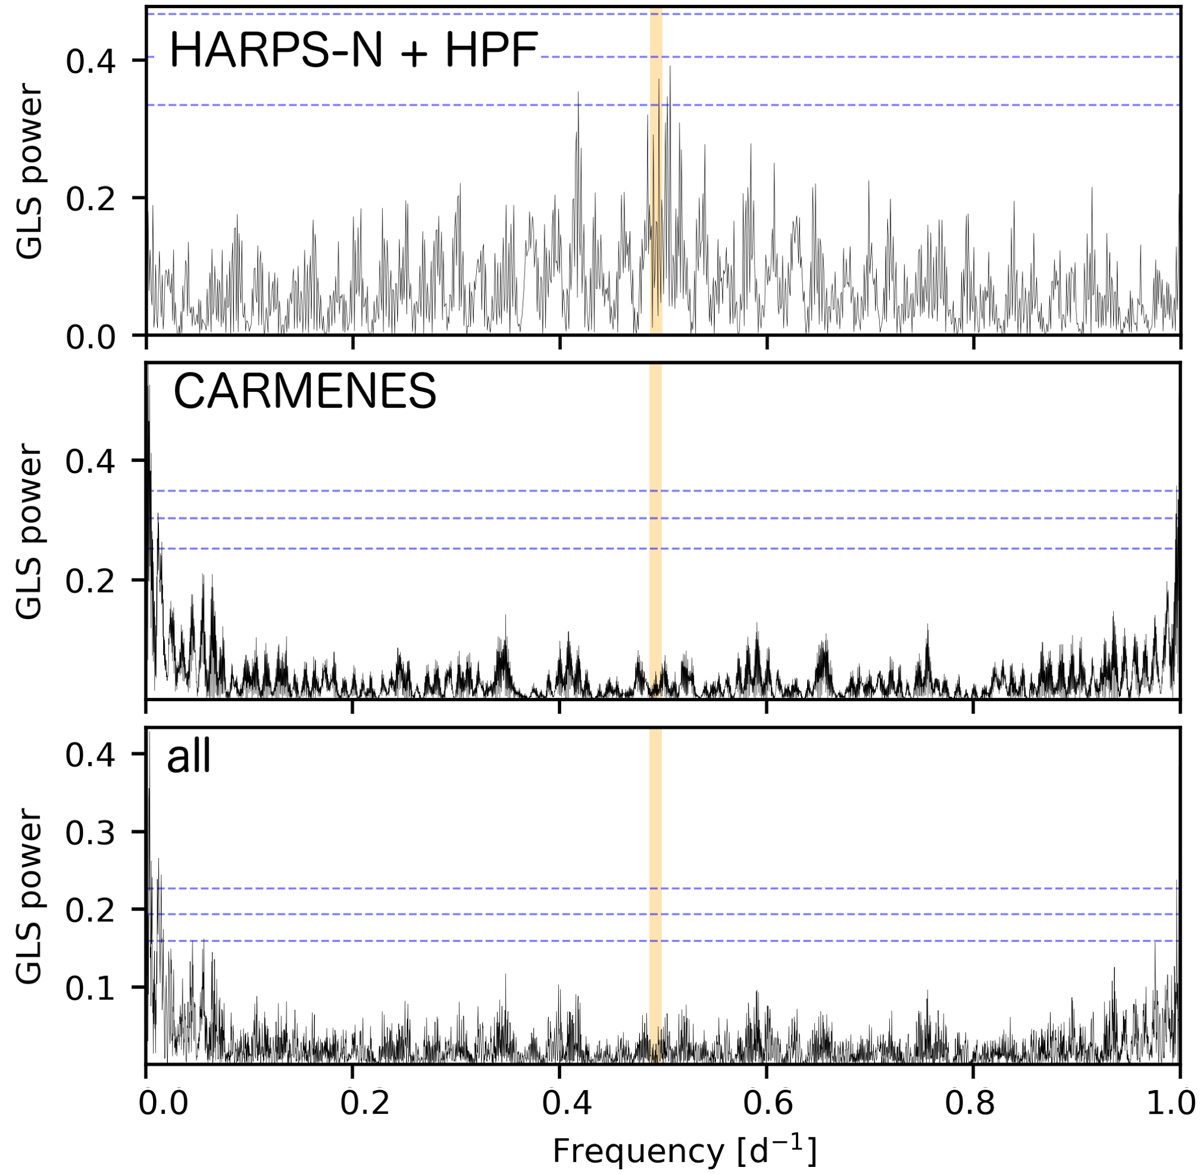
Periodograms of the RVs as observed of the combined HARPS-N and HPF data sets (top panel), the individual CARMENES data set (middle panel), and the combined full RV data set (bottom panel). The orange vertical line highlights a period of 2.02 d, and the horizontal blue dashed lines indicate analytical false-alarm probabilities of 10, 1, and 0.1% (from bottom to top). The y axis is shown up to the largest GLS power or the 0.1% FAP level.
Current usage metrics show cumulative count of Article Views (full-text article views including HTML views, PDF and ePub downloads, according to the available data) and Abstracts Views on Vision4Press platform.
Data correspond to usage on the plateform after 2015. The current usage metrics is available 48-96 hours after online publication and is updated daily on week days.
Initial download of the metrics may take a while.