Fig. 1.
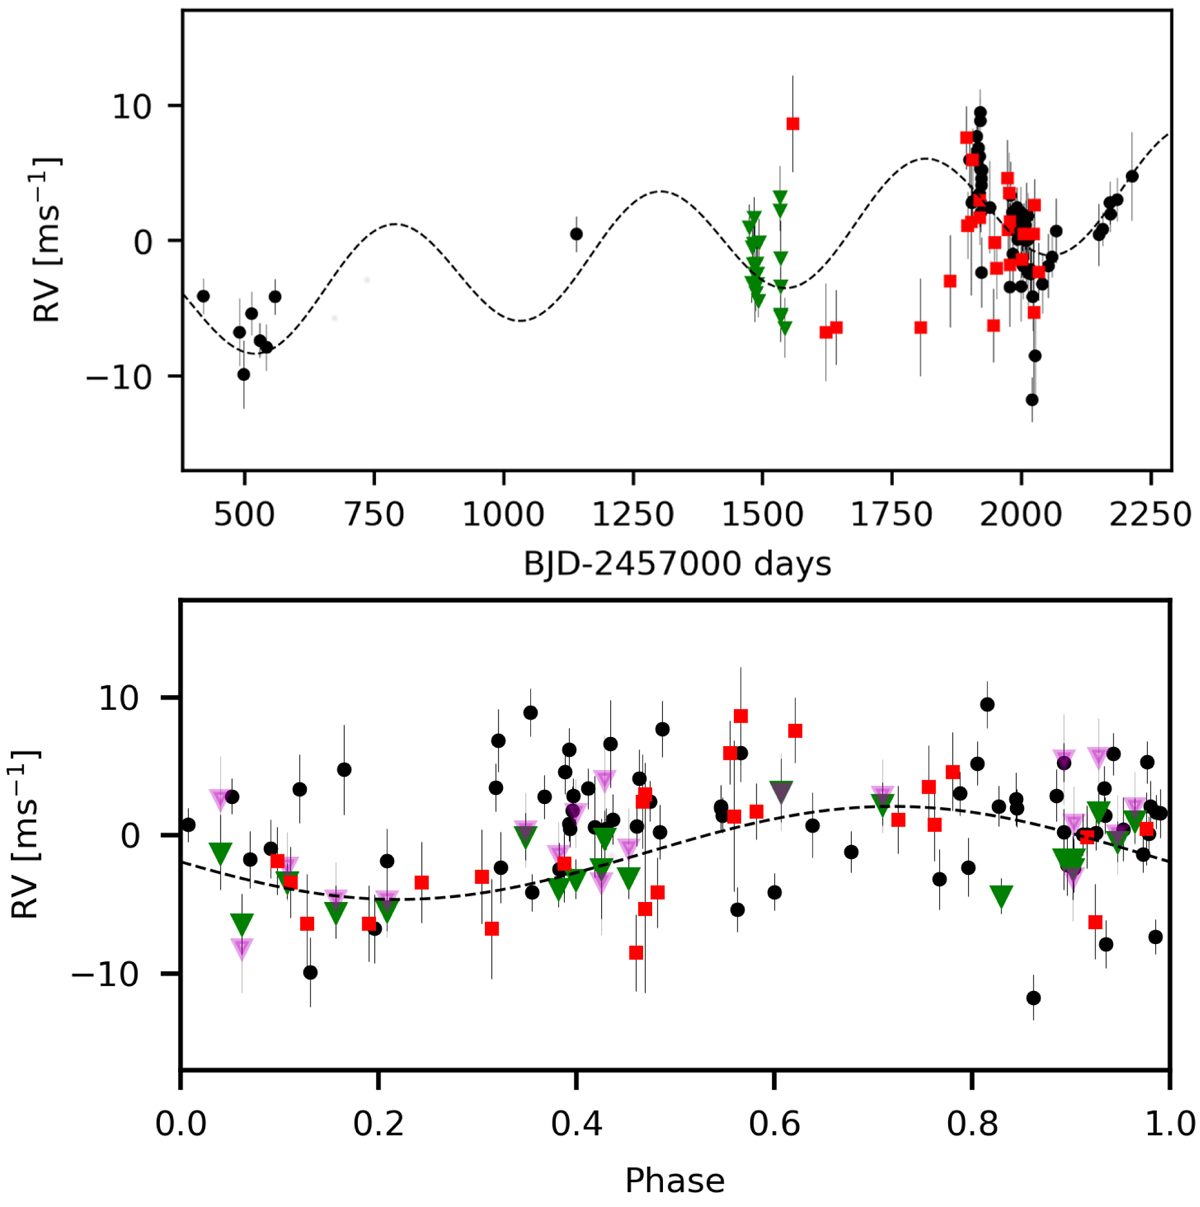
RV data as observed from HARPS-N (green triangles), HPF (red squares), and CARMENES (black dots) in time series (top panel), and phase-folded (bottom panel) to the 2.02-day period of the planet candidate announced by Mahadevan et al. (2021). Top panel: we include the best-fitting linear trend of 1.73 m s−1 and the long-period signal of ∼500 d represented by the black dashed line. Bottom panel: we also show the HARPS-N data as derived by the wobble code represented by magenta triangles.
Current usage metrics show cumulative count of Article Views (full-text article views including HTML views, PDF and ePub downloads, according to the available data) and Abstracts Views on Vision4Press platform.
Data correspond to usage on the plateform after 2015. The current usage metrics is available 48-96 hours after online publication and is updated daily on week days.
Initial download of the metrics may take a while.