Fig. 5.
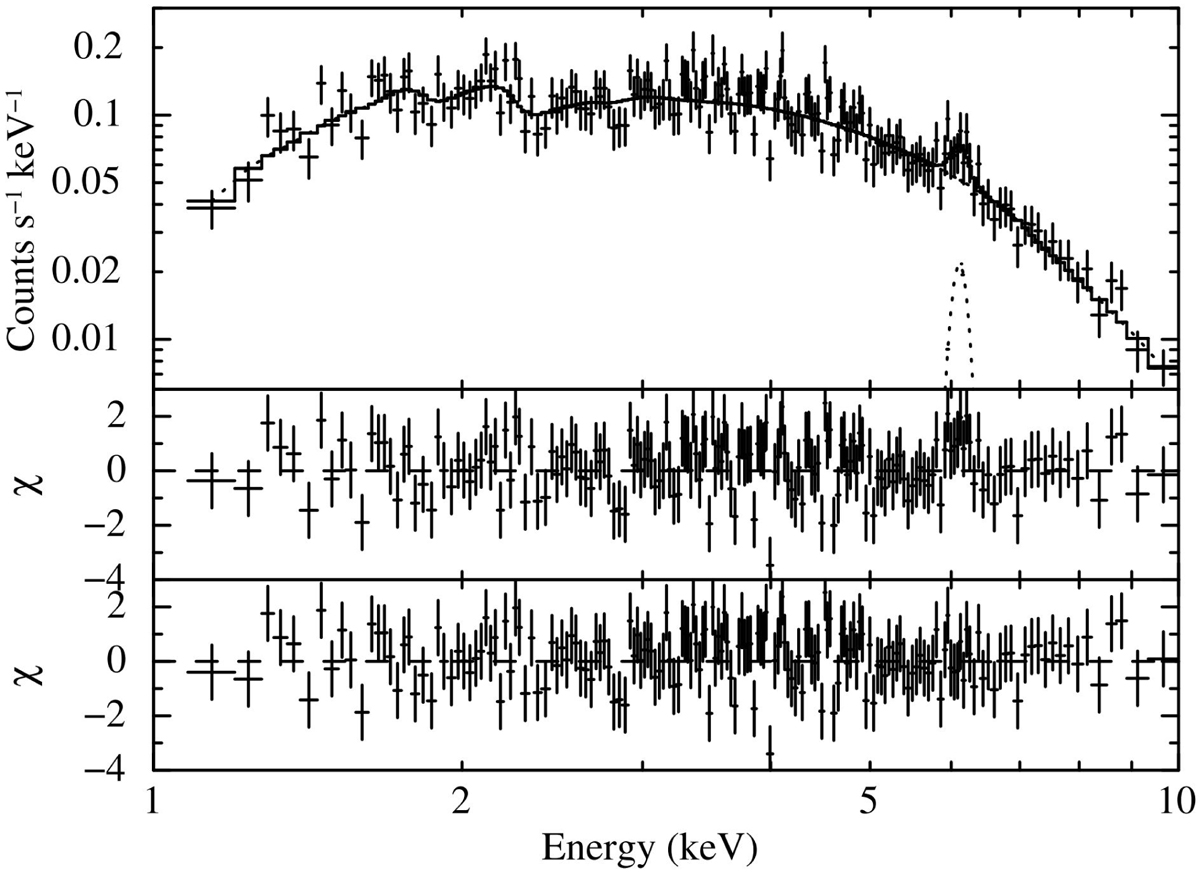
EPIC spectrum of CXOU J225355.1+624336 corresponding to phase range A. Upper panel: overlap of the spectrum with the best-fitting TBPCF×(PL+Gaussian) emission model, where the Gaussian component is shown. Middle panel: data-model residuals, in units of standard deviation (σ), in the case of the best-fitting TBPCF×PL model. Lower panel: data-model residuals, in units of standard deviation (σ), in the case of the best-fitting TBPCF×(PL+Gaussian) model.
Current usage metrics show cumulative count of Article Views (full-text article views including HTML views, PDF and ePub downloads, according to the available data) and Abstracts Views on Vision4Press platform.
Data correspond to usage on the plateform after 2015. The current usage metrics is available 48-96 hours after online publication and is updated daily on week days.
Initial download of the metrics may take a while.