Fig. 1.
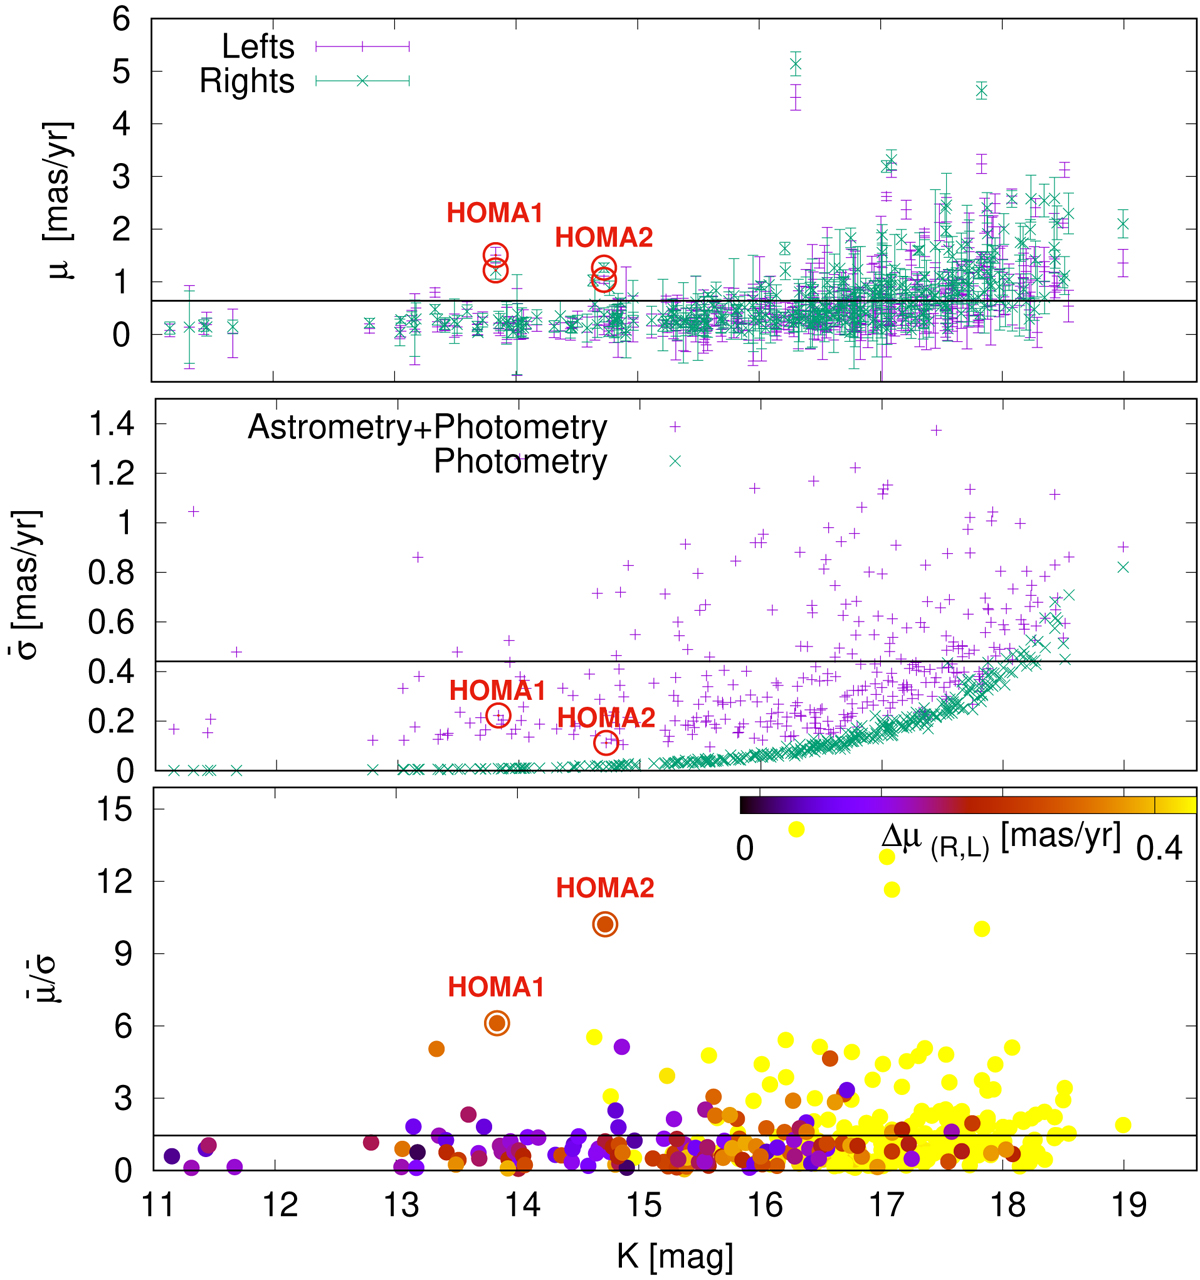
Astrometric analysis of 339 reliable sources, common between 2015 and 2018, left and right data. Top: shift of stars, measured in the right (green crosses) and left (purple pluses) data vs their K magnitudes. Middle: total error (purple pluses) and photometric error (green crosses) on the positions of the detected sources, averaged between the left and right data vs their K magnitudes. Bottom: shift of a star over its total error (![]() ) vs its K magnitudes, colour-coded by Δμ(R, L). The horizontal black lines show the average value for all 339 sources.
) vs its K magnitudes, colour-coded by Δμ(R, L). The horizontal black lines show the average value for all 339 sources.
Current usage metrics show cumulative count of Article Views (full-text article views including HTML views, PDF and ePub downloads, according to the available data) and Abstracts Views on Vision4Press platform.
Data correspond to usage on the plateform after 2015. The current usage metrics is available 48-96 hours after online publication and is updated daily on week days.
Initial download of the metrics may take a while.