Fig. 7
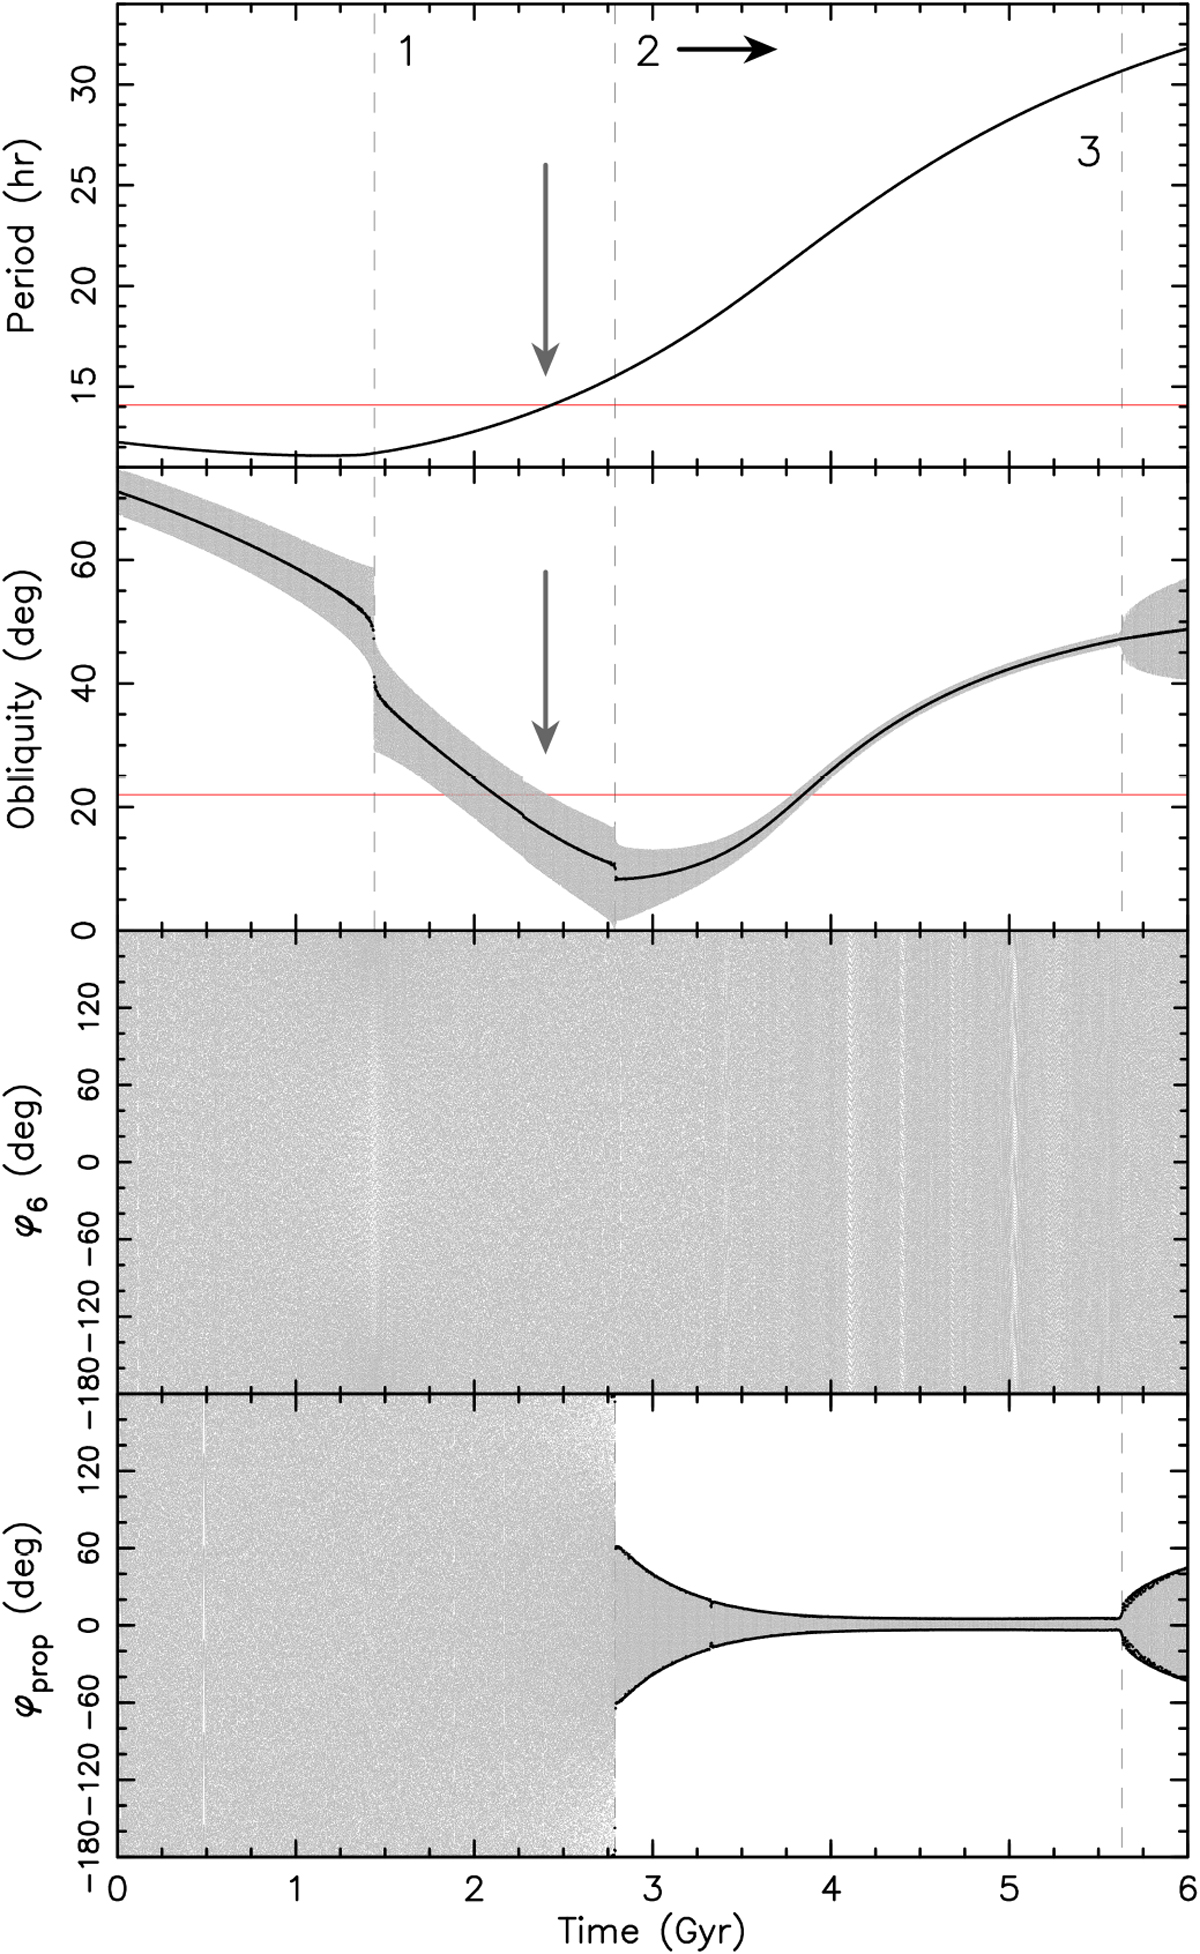
Example of a possible long-term evolution of the rotation state for (208) Lacrimosa. Rotation period P (top), osculating obliquity ε (middle-up),and longitude φ in the orbital frame associated with the s6-frequency and s-frequency term of the nodal precession (middle-down and bottom; note φ is measured from an axis 90° away from the corresponding nodal line). The gray dots are densely output osculating values (with a time-step of 5 kyr). Black symbols in the obliquity panel are average values in a 2 Myr running window; black symbols in the bottom panels are maximum and minimum values of the respective longitude in a 2 Myr running window. The dynamical model uses solar gravitational torque and the YORP effect with parameters determined from the best-fitting solution in Sect. 2. The red lines in the upper two panels show the present state of (208) Lacrimosa for reference. At the epoch of ≃ 2.4 Gyr, the propagated spin evolution roughly matches the present state (as indicated by the gray arrows). At ≃ 1.45 Gyr (verticaldashed line 1), the solution jumps over the Slivan state of the s6 precession frequency, where other large Koronis prograde-rotating asteroids are located. At ≃ 2.8 Gyr (vertical dashed line 2), the solution starts to closely follow the Cassini state 2 associated with the s precession frequency. This is allowed by (i) the low obliquity (where C2 is located), and (ii) the increasing rotation period. The Cassini resonance formally bifurcates when the rotation period reaches ≃24.4 h, i.e., at ≃4.1 Gyr. Finally, at ≃5.63 Gyr (vertical dashed line 3), the small-amplitude oscillations about the resonant Cassini state 2 in the s precession frequency frame become perturbed by an overlap with the Cassini resonance associated with the s6 precession frequency. The simulations had an initial rotation period of 12.25 h and an initial obliquity of 70°.
Current usage metrics show cumulative count of Article Views (full-text article views including HTML views, PDF and ePub downloads, according to the available data) and Abstracts Views on Vision4Press platform.
Data correspond to usage on the plateform after 2015. The current usage metrics is available 48-96 hours after online publication and is updated daily on week days.
Initial download of the metrics may take a while.