Fig. 2
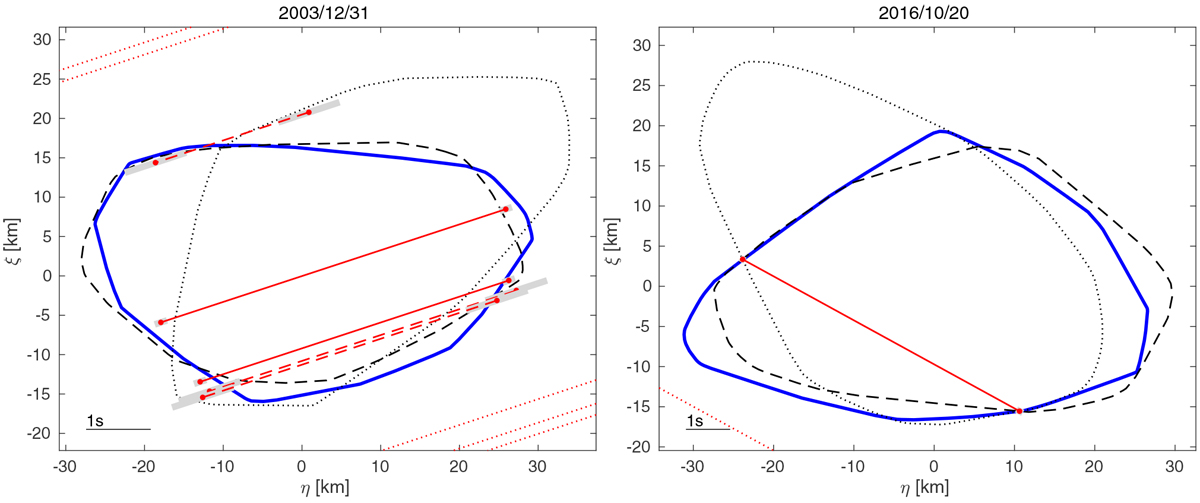
Projections of two occultations from December 31, 2003 (left), and October 20, 2016 (right). Individual observations are shown as straight red lines. Solid lines are photoelectric observations, dashed are visual observations, and dotted are negative observations. Timing errors are displayed as gray strips. The blue solid silhouette is that of the best-fit model, the dotted silhouette is of the second pole solution, and the dashed silhouette is of the IR-based shape model without any scaling. North is up, west to the right.
Current usage metrics show cumulative count of Article Views (full-text article views including HTML views, PDF and ePub downloads, according to the available data) and Abstracts Views on Vision4Press platform.
Data correspond to usage on the plateform after 2015. The current usage metrics is available 48-96 hours after online publication and is updated daily on week days.
Initial download of the metrics may take a while.