Fig. C.4
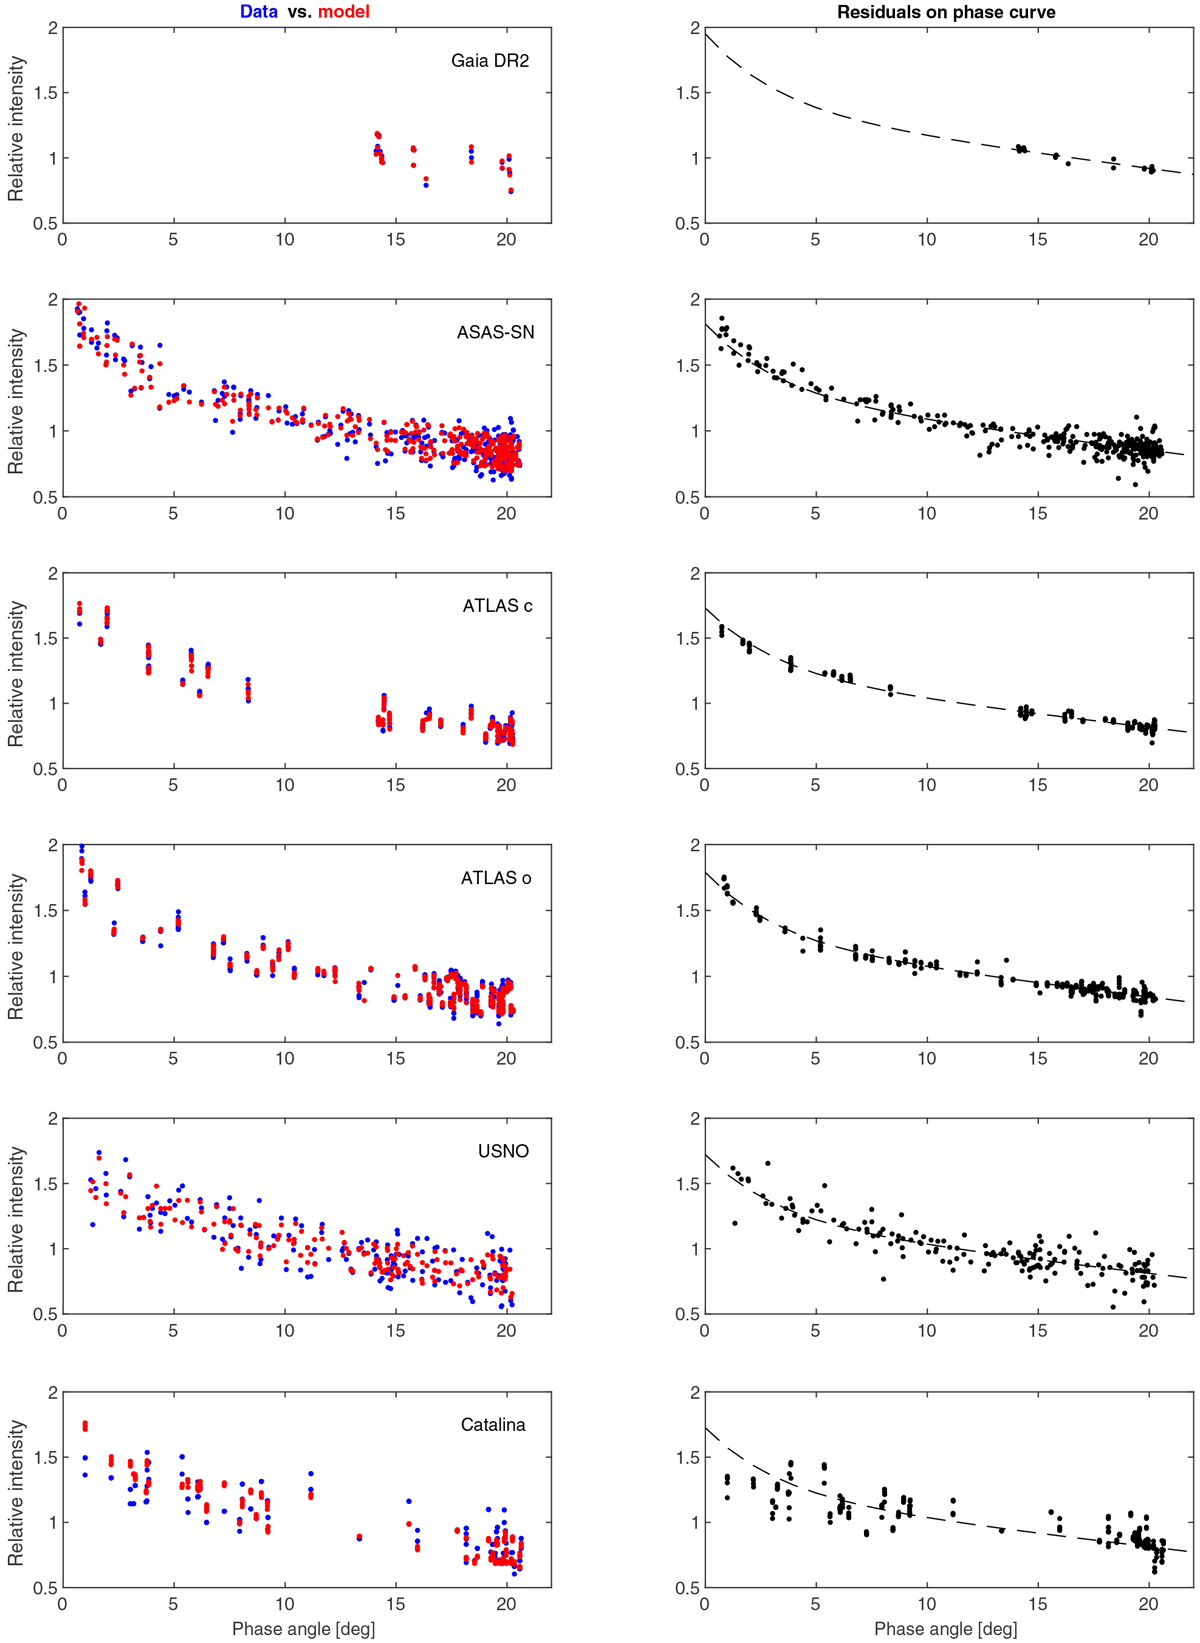
Left: observed sparse photometric data with their brightness reduced to a unit distance from the Sun and the Earth (blue points) and synthetic data produced by the best-fitting model with the pole direction (15°, 67°) and rotation period 14.085734 h (red points). Right: residuals (the difference between data and model) plotted on the model phase curve (dashed curve).
Current usage metrics show cumulative count of Article Views (full-text article views including HTML views, PDF and ePub downloads, according to the available data) and Abstracts Views on Vision4Press platform.
Data correspond to usage on the plateform after 2015. The current usage metrics is available 48-96 hours after online publication and is updated daily on week days.
Initial download of the metrics may take a while.