Fig. 14
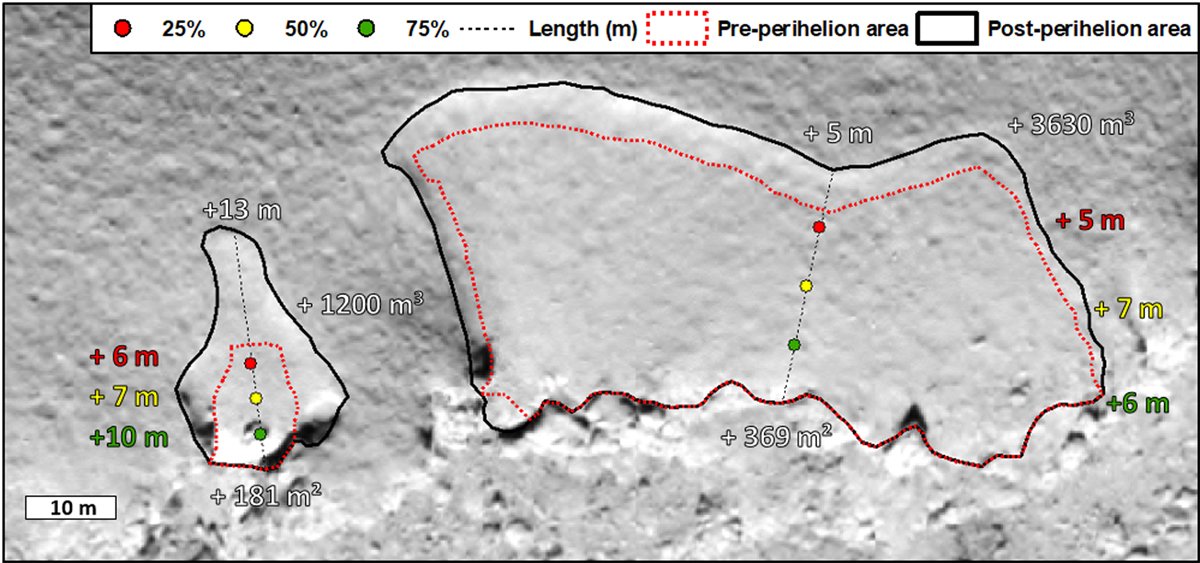
Geometrical comparison of the two depressions, showing the measured changes. The dotted red lines indicates the shape of the depression before perihelion; there is an uncertainty of about 1 m on the position of this contour, due to the different illumination conditions of the images used to define the contour before and after perihelion. The increase in lengths, widths, and areas, are labeled. Table 5 summarizes the measured changes, with the value of growth and growth ratio for each parameter.
Current usage metrics show cumulative count of Article Views (full-text article views including HTML views, PDF and ePub downloads, according to the available data) and Abstracts Views on Vision4Press platform.
Data correspond to usage on the plateform after 2015. The current usage metrics is available 48-96 hours after online publication and is updated daily on week days.
Initial download of the metrics may take a while.