Fig. 7
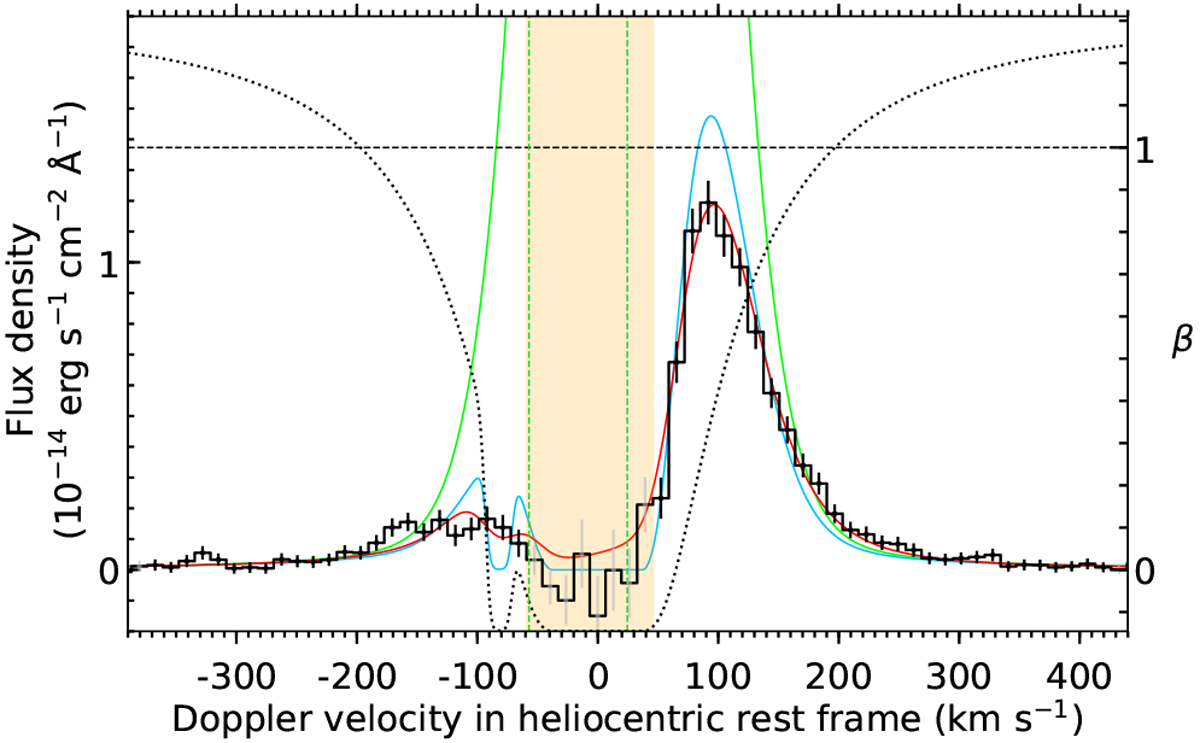
Lyman-α line profile of WASP-29 averaged over the three visits. The black histogram shows the observed spectra, fit over points with black error bars. The orange band shows the region strongly contaminated by geocoronal emission to be excluded from the fit. The green full line is the best fit for the intrinsic stellar line profile, and the green dotted line represents the zero velocity in the stellar rest frame. It yields the blue profile after absorption by the interstellar medium, whose profile is plotted as a dotted black line (ISM absorption in the range 0–1 has been scaled to the vertical axis range). The red line shows the line profile fit to the data, after convolution with the STIS instrumental profile. The theoretical intrinsic stellar line profile also corresponds to the profile of the ratio β between radiation pressure and stellar gravity, which is shown in the right y-axis.
Current usage metrics show cumulative count of Article Views (full-text article views including HTML views, PDF and ePub downloads, according to the available data) and Abstracts Views on Vision4Press platform.
Data correspond to usage on the plateform after 2015. The current usage metrics is available 48-96 hours after online publication and is updated daily on week days.
Initial download of the metrics may take a while.