Free Access
Fig. 7
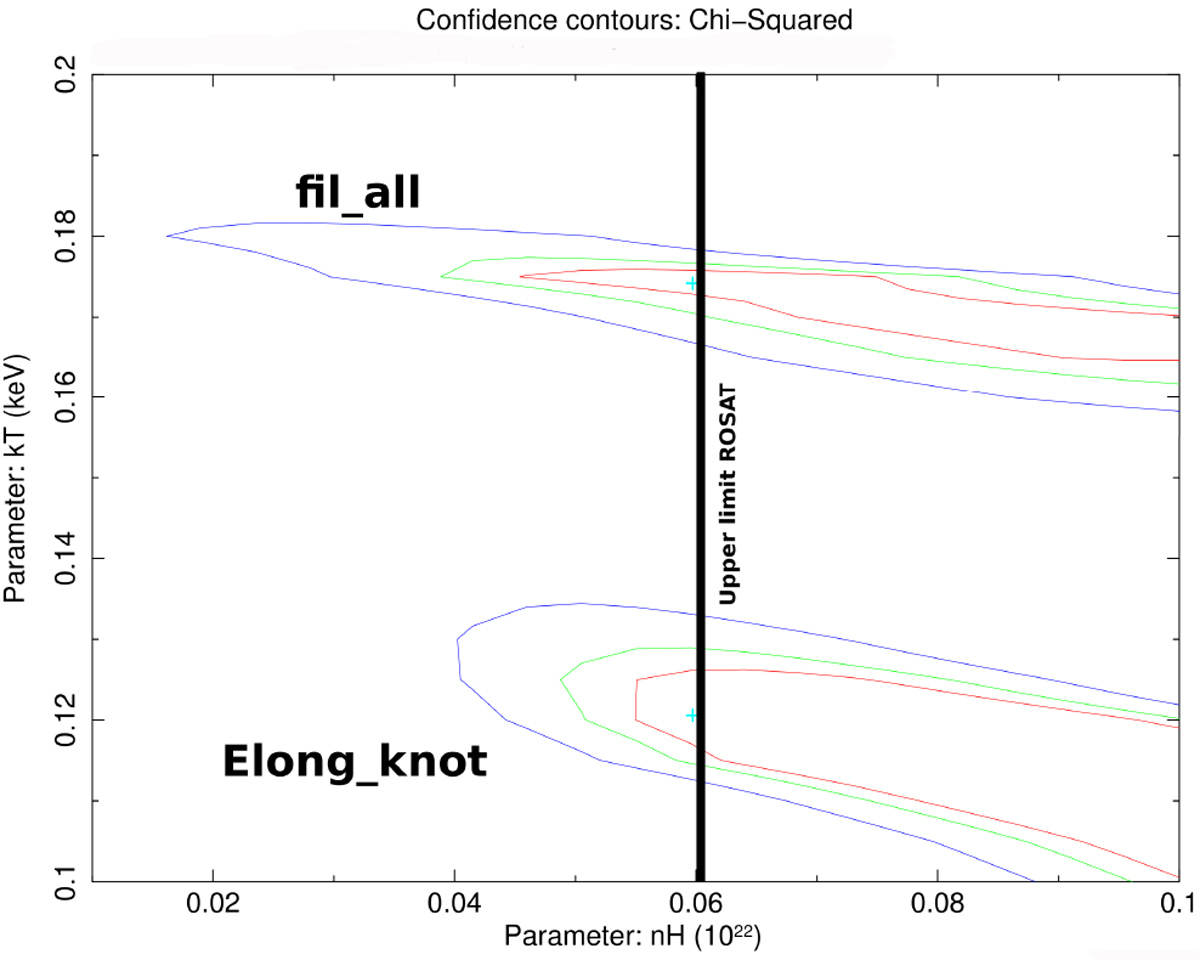
68 (red), 95 (green), and 99.5% (blue) contour levels of the NH vs. kT best fit values, as derived from the spectral analysis of the fil_all and Elong_knot spectra. The black line shows the upper limit for NH found by Lu & Aschenbach (2000).
Current usage metrics show cumulative count of Article Views (full-text article views including HTML views, PDF and ePub downloads, according to the available data) and Abstracts Views on Vision4Press platform.
Data correspond to usage on the plateform after 2015. The current usage metrics is available 48-96 hours after online publication and is updated daily on week days.
Initial download of the metrics may take a while.