Fig. 5
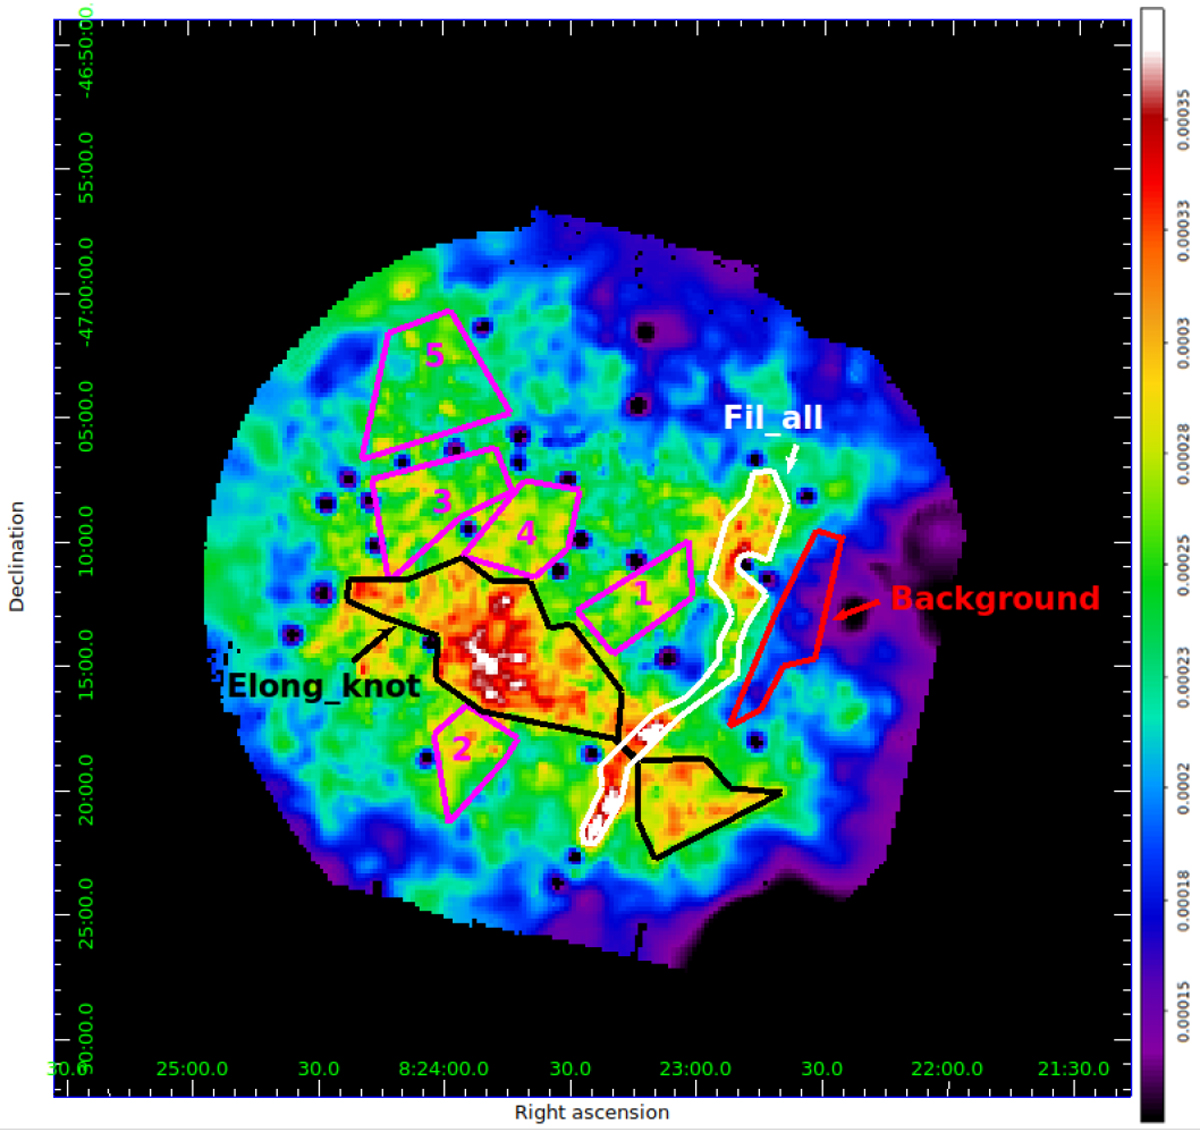
EPIC count-rate image in the 0.3−1.0 keV energy band in linear scale. The bin size is 10″ and the image was adaptively smoothed to a signal-to-noise ratio of 20. Regions selected to extract the spectra of the elongated knot (black polygon) and of the filament (white polygon) are superimposed. The region selected for background extraction is shown in red. The regions selected to extract control spectra are shown in magenta (see Sect. 3.3).
Current usage metrics show cumulative count of Article Views (full-text article views including HTML views, PDF and ePub downloads, according to the available data) and Abstracts Views on Vision4Press platform.
Data correspond to usage on the plateform after 2015. The current usage metrics is available 48-96 hours after online publication and is updated daily on week days.
Initial download of the metrics may take a while.