Free Access
Fig. 12
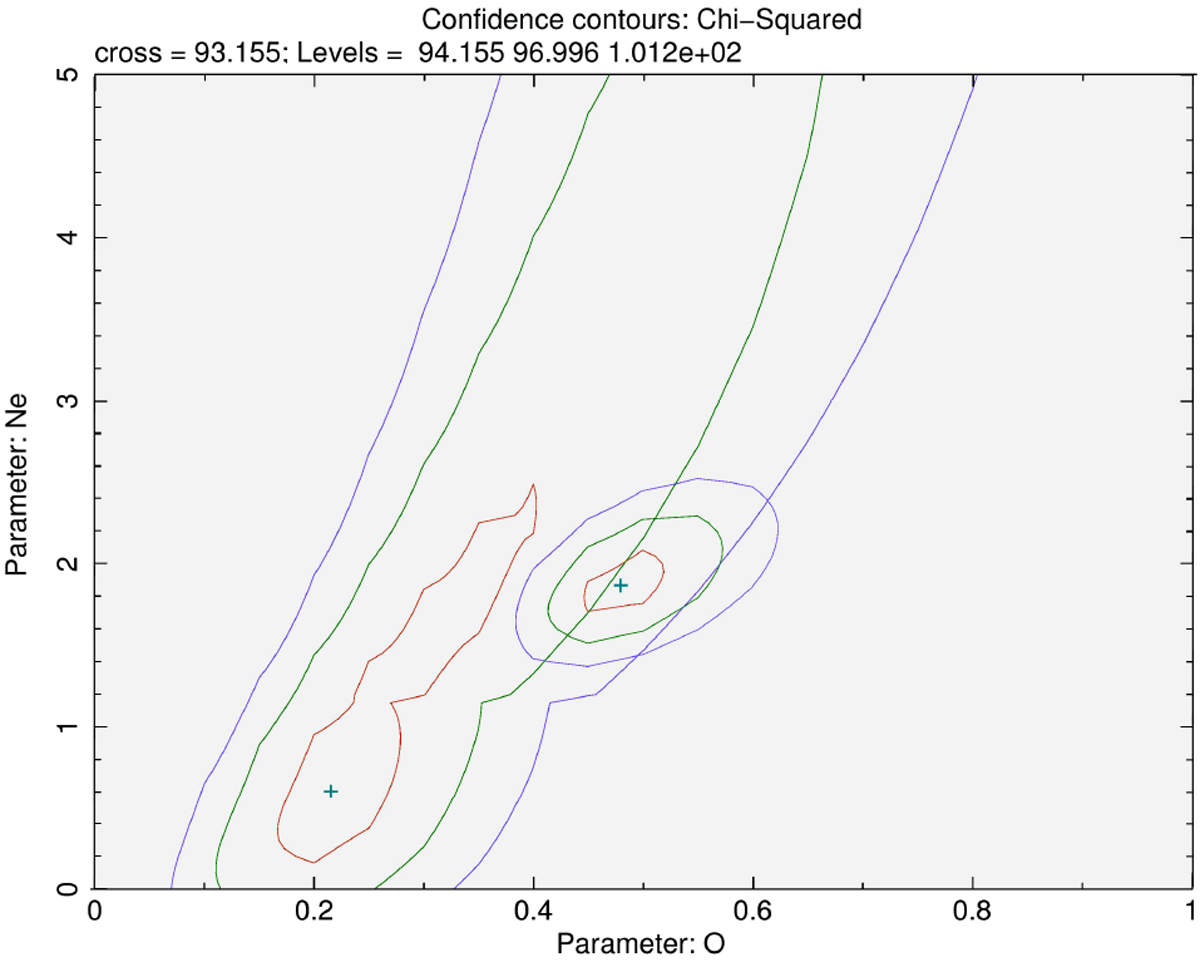
68 (red), 95 (green), and 99.5% (blue) contour levels of the Ne abundance vs. O derived from the spectral analysis of the Ext_fil spectrum with the same contour levels of fil_all spectrum superimposed.
Current usage metrics show cumulative count of Article Views (full-text article views including HTML views, PDF and ePub downloads, according to the available data) and Abstracts Views on Vision4Press platform.
Data correspond to usage on the plateform after 2015. The current usage metrics is available 48-96 hours after online publication and is updated daily on week days.
Initial download of the metrics may take a while.