Fig. 4
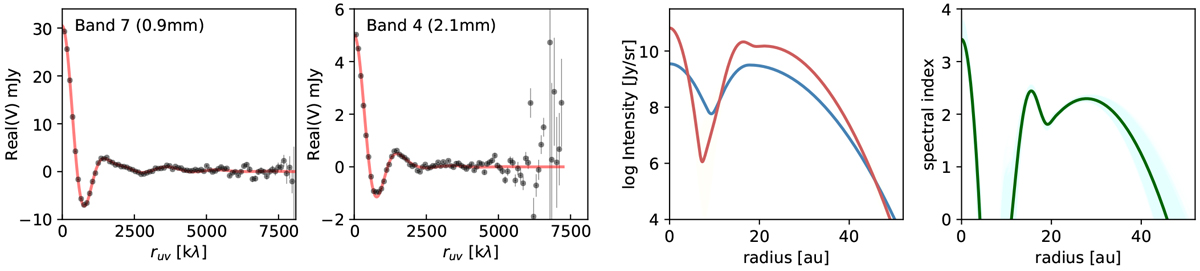
From left to right: real part of the visibilities after centering and deprojecting the data in Band 7 and in Band 4 vs. the best-fit model from galario of the continuum data. Intensity profile from the best fit in Band 7 and Band 4 (orange and blue line, respectively), with 5000 randomly selected chains after convergence overlaid. Right panel: spectral index radial profile obtained from the intensity profiles.
Current usage metrics show cumulative count of Article Views (full-text article views including HTML views, PDF and ePub downloads, according to the available data) and Abstracts Views on Vision4Press platform.
Data correspond to usage on the plateform after 2015. The current usage metrics is available 48-96 hours after online publication and is updated daily on week days.
Initial download of the metrics may take a while.