Fig. 3
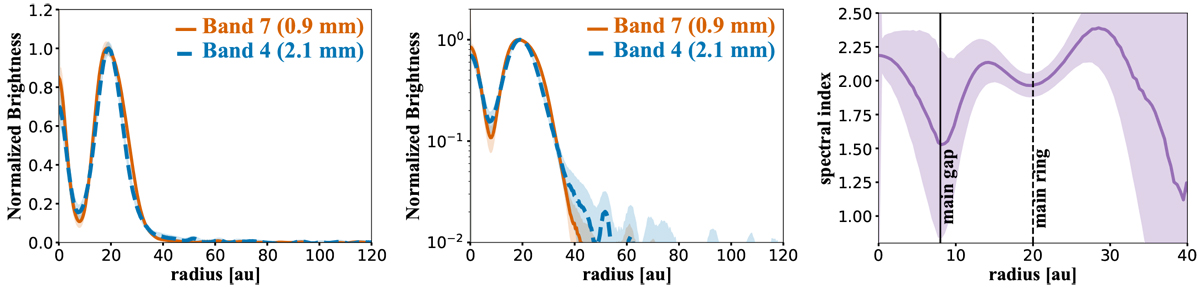
Azimuthally averaged radial intensity profiles of the deprojected continuum images (lineal scale on the left and logarithmic scale in the center) at each wavelength. Each profile is normalized to the peak. The profiles are obtained from images that are restored with the same beam (50 mas × 34 mas). The error bars include the standard deviation of each elliptical bin divided by the square root of the number of beams spanning the full azimuthal angle at each radial bin. The right panel shows the radial profile of the spectral index taking into account the errors on the radial intensity profiles in addition to 10% of the error due to flux calibration.
Current usage metrics show cumulative count of Article Views (full-text article views including HTML views, PDF and ePub downloads, according to the available data) and Abstracts Views on Vision4Press platform.
Data correspond to usage on the plateform after 2015. The current usage metrics is available 48-96 hours after online publication and is updated daily on week days.
Initial download of the metrics may take a while.