Fig. 4.
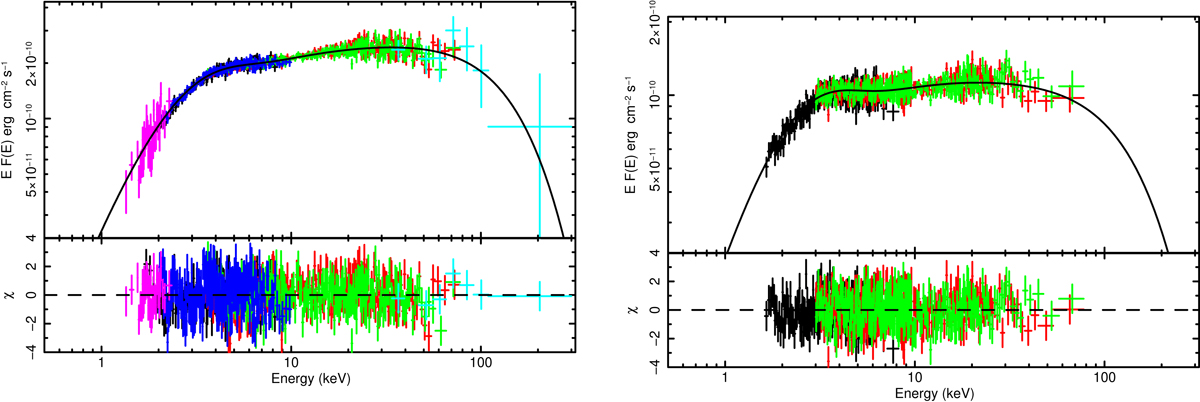
Unfolded and unabsorbed broadband spectra of Swift J1756.9–2508. Left panel: spectrum for the 2018 outburst in the 1–250 keV energy range. The data points are obtained from the combined of two XMM-Newton RGS instruments (magenta datapoints, ∼1.2–2.4 keV), XMM-Newton EPIC-MOS2 (blue points, 2–10 keV), NICER (black points, 1.5–10 keV) NuSTAR FPMA/FPMB (red and green points, 3.5–80 keV), and INTEGRAL-ISGRI (cyan points, 30–250 keV). Right panel: spectrum of the 2019 outburst in the 1.5–80 keV energy range. The data points are obtained from the NICER (black points, ∼1.5–10 keV), NuSTAR FPMA/FPMB (red and green points, 3–80 keV). In both cases, the fits are obtained with the COMPPS model, represented with a solid line. The residuals from the best fit are shown at the bottom.
Current usage metrics show cumulative count of Article Views (full-text article views including HTML views, PDF and ePub downloads, according to the available data) and Abstracts Views on Vision4Press platform.
Data correspond to usage on the plateform after 2015. The current usage metrics is available 48-96 hours after online publication and is updated daily on week days.
Initial download of the metrics may take a while.