Fig. 3.
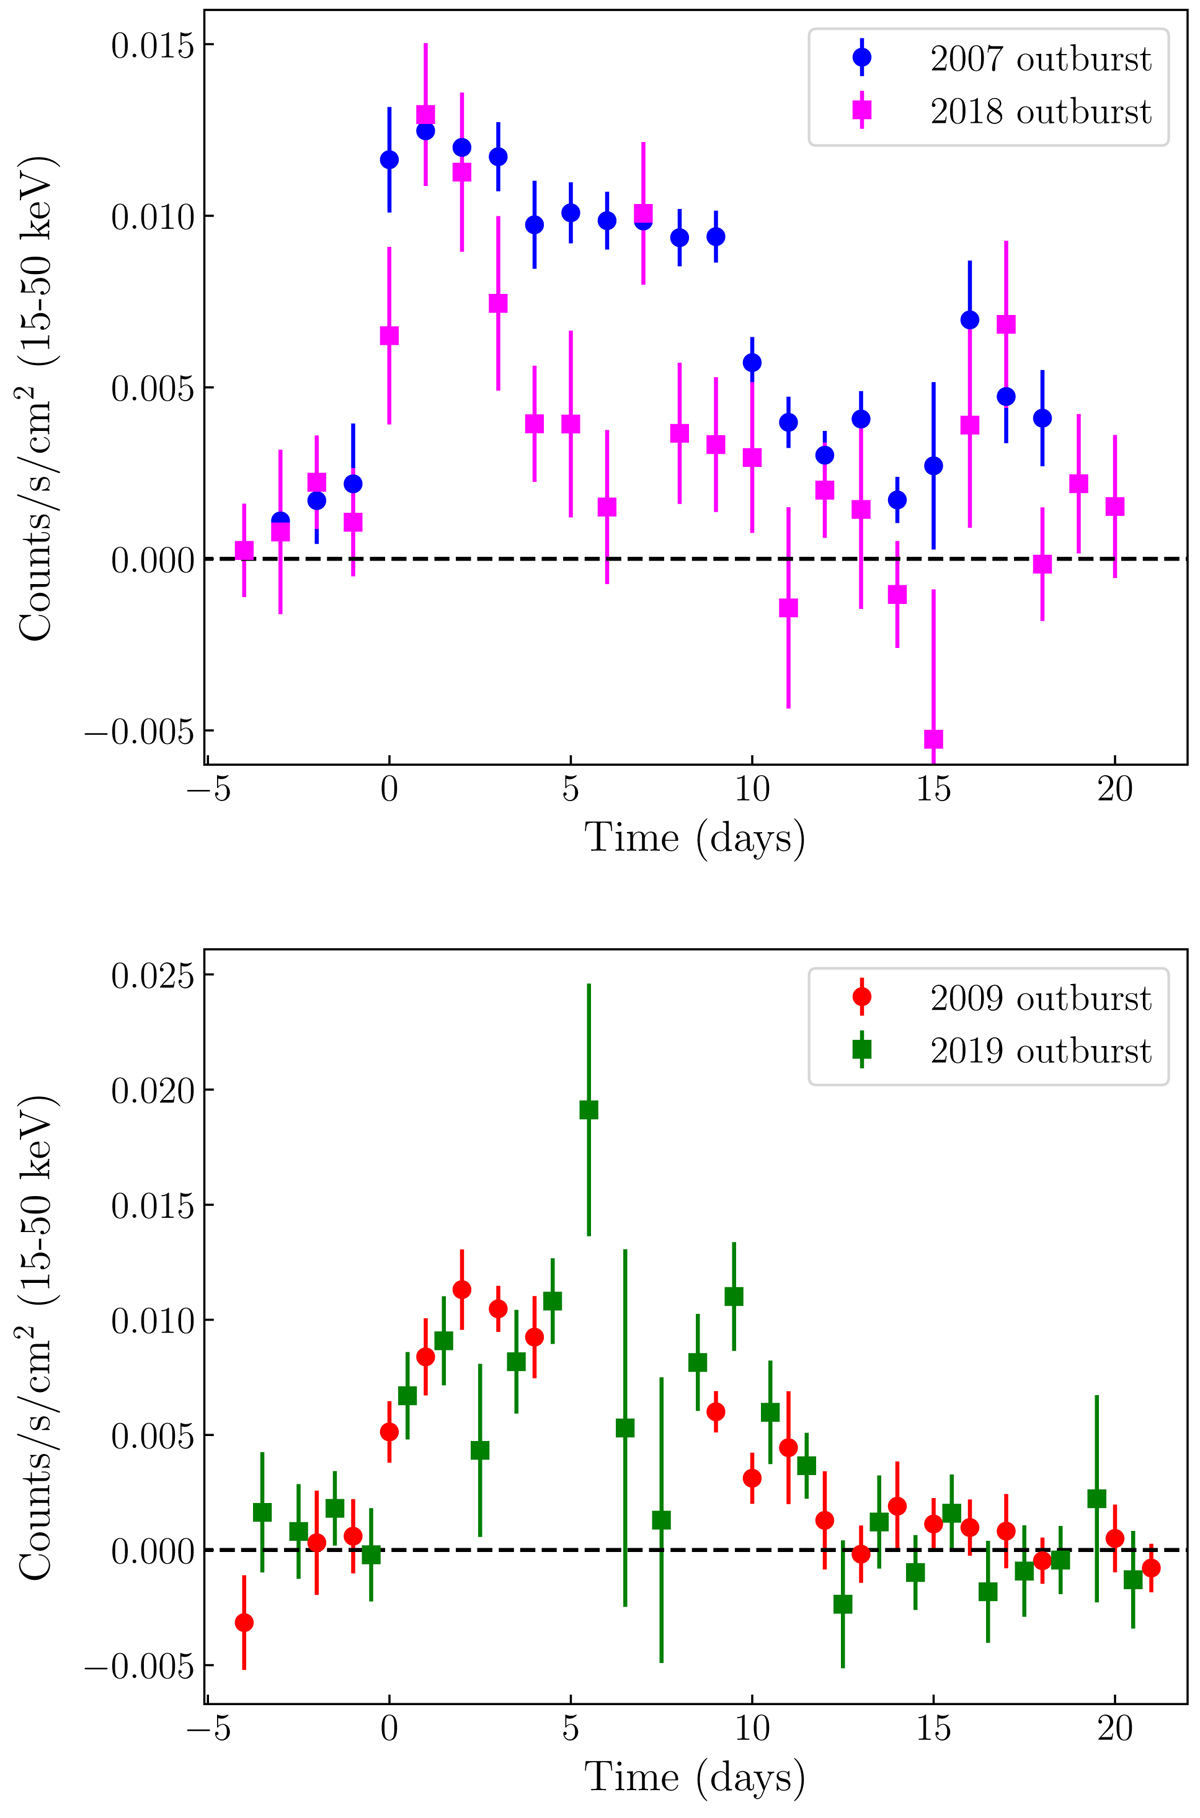
Swift-BAT daily averaged (15–50 keV) profiles of the 2007 (blue dots) and 2018 (magenta squares) outbursts (top panel), the 2009 (red dots), and 2019 (greed squares) outbursts (bottom panel) from Swift J1756.9–2508. The start time of the 2007, 2009, 2018, and 2019 outbursts are MJD 54258, 55012, 58208, and 58644.5, respectively.
Current usage metrics show cumulative count of Article Views (full-text article views including HTML views, PDF and ePub downloads, according to the available data) and Abstracts Views on Vision4Press platform.
Data correspond to usage on the plateform after 2015. The current usage metrics is available 48-96 hours after online publication and is updated daily on week days.
Initial download of the metrics may take a while.