Free Access
Fig. 2.
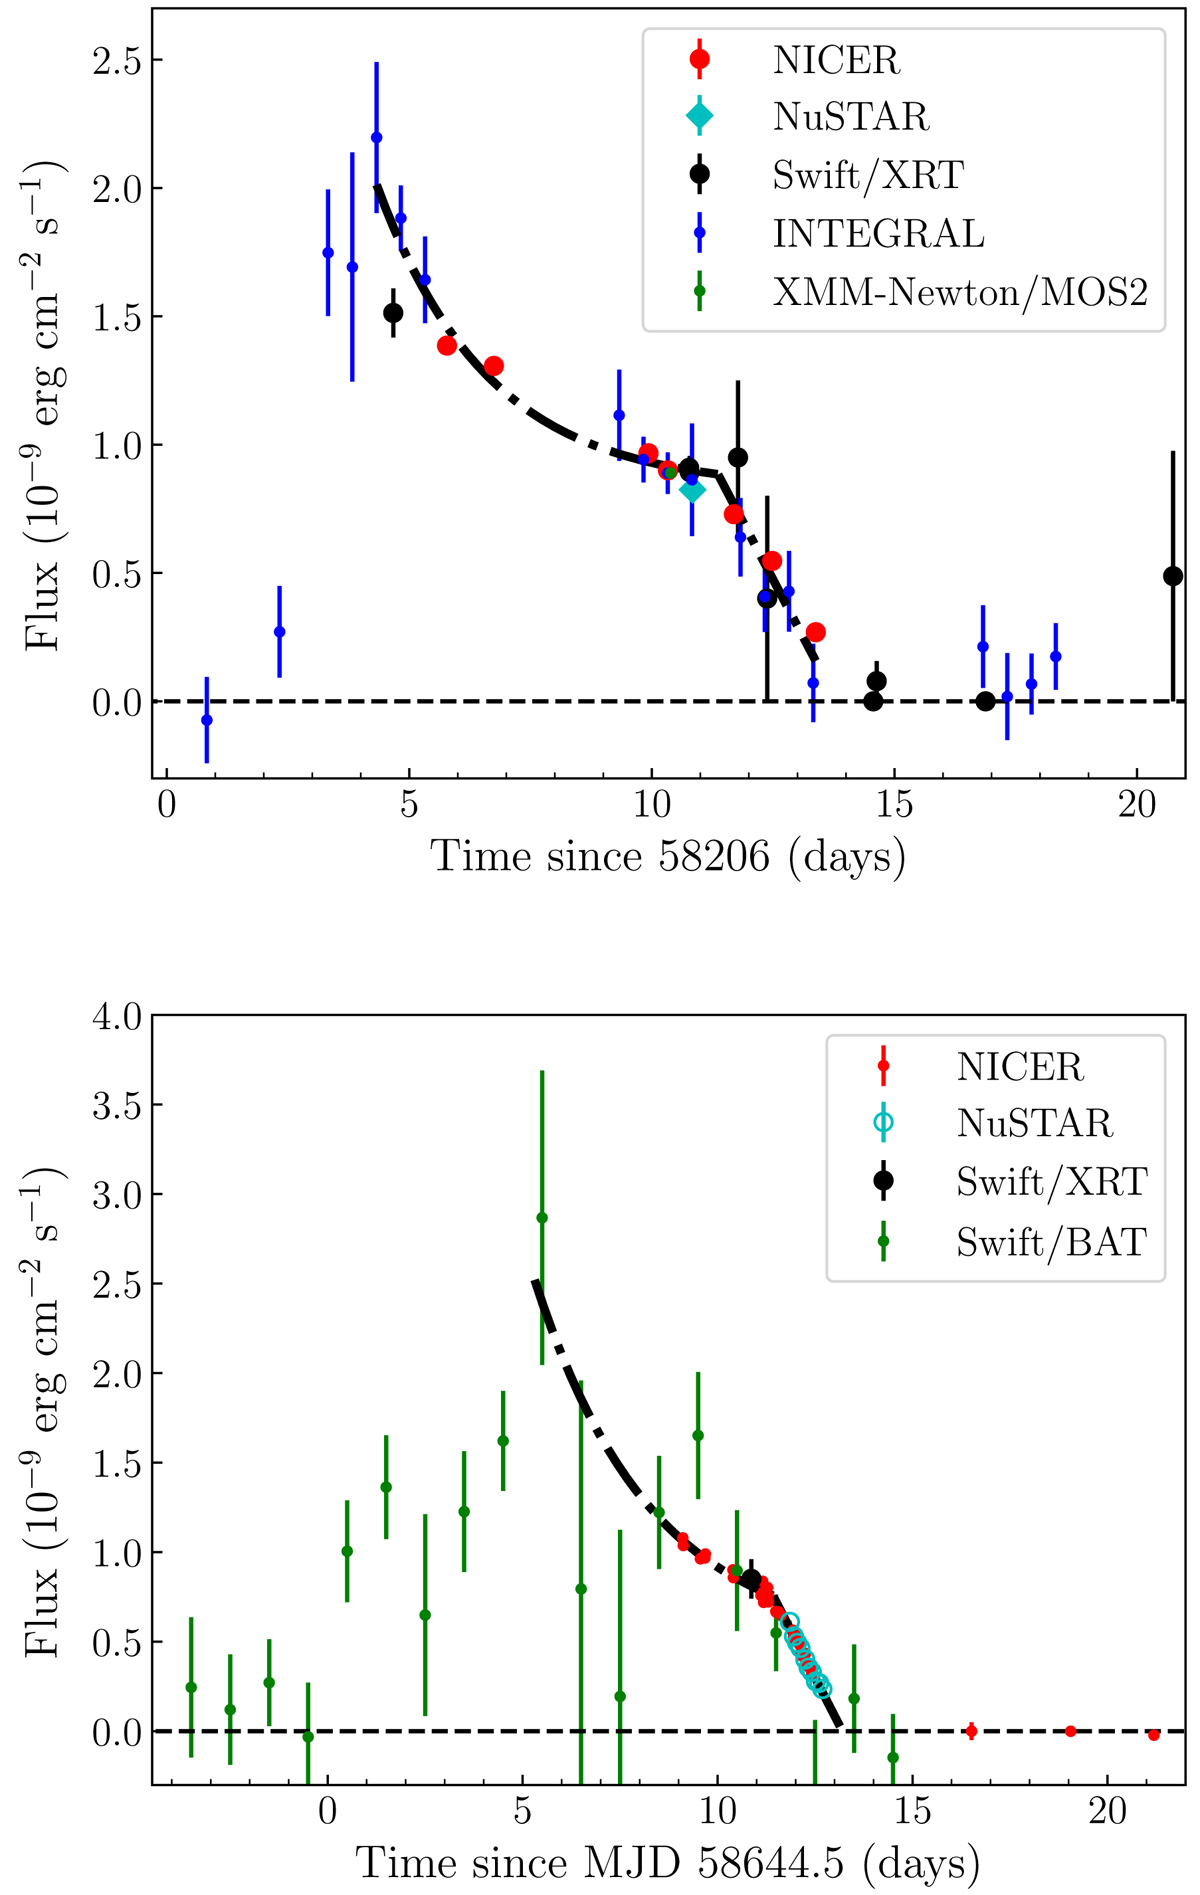
Evolution of the bolometric fluxes (0.1–300 keV) of Swift J1756.9–2508 for the 2018 (top panel) and 2019 (bottom panel) outbursts; see Sect. 3 for more details. The dot-dash lines correspond to the best-fit exponential profile, F ∝ e−t/2.3 d and F ∝ e−t/3 d, followed by a linear decay, respectively.
Current usage metrics show cumulative count of Article Views (full-text article views including HTML views, PDF and ePub downloads, according to the available data) and Abstracts Views on Vision4Press platform.
Data correspond to usage on the plateform after 2015. The current usage metrics is available 48-96 hours after online publication and is updated daily on week days.
Initial download of the metrics may take a while.