Fig. 5
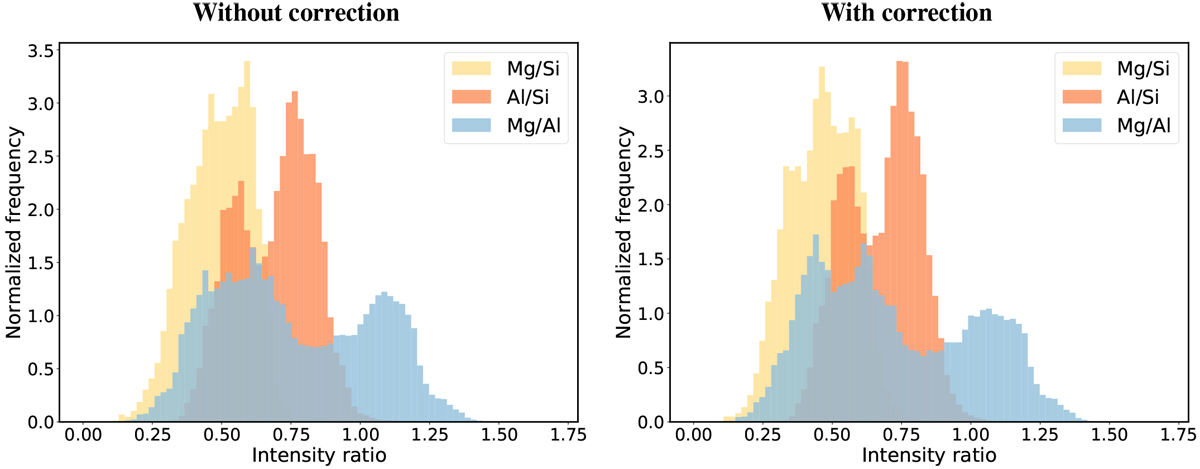
Frequency distributions (normalized number of intensity ratios observed) of Al/Si, Mg/Si, and Mg/Al after mapping. Left: distributions without correction of Apollo 16 data. Right: distributions with Apollo 16 data corrected for softening of Solar spectrum. The corrections result in additional peaks appearing in the Mg/Al and Mg/Si distributions, which is due to the relatively low values measured for Mg/Si and Mg/Al of the highland area between ~ 100–150 degrees longitude by Apollo 16. In both figures, the intensity ratio bin width is approximately 0.02.
Current usage metrics show cumulative count of Article Views (full-text article views including HTML views, PDF and ePub downloads, according to the available data) and Abstracts Views on Vision4Press platform.
Data correspond to usage on the plateform after 2015. The current usage metrics is available 48-96 hours after online publication and is updated daily on week days.
Initial download of the metrics may take a while.