Fig. 3
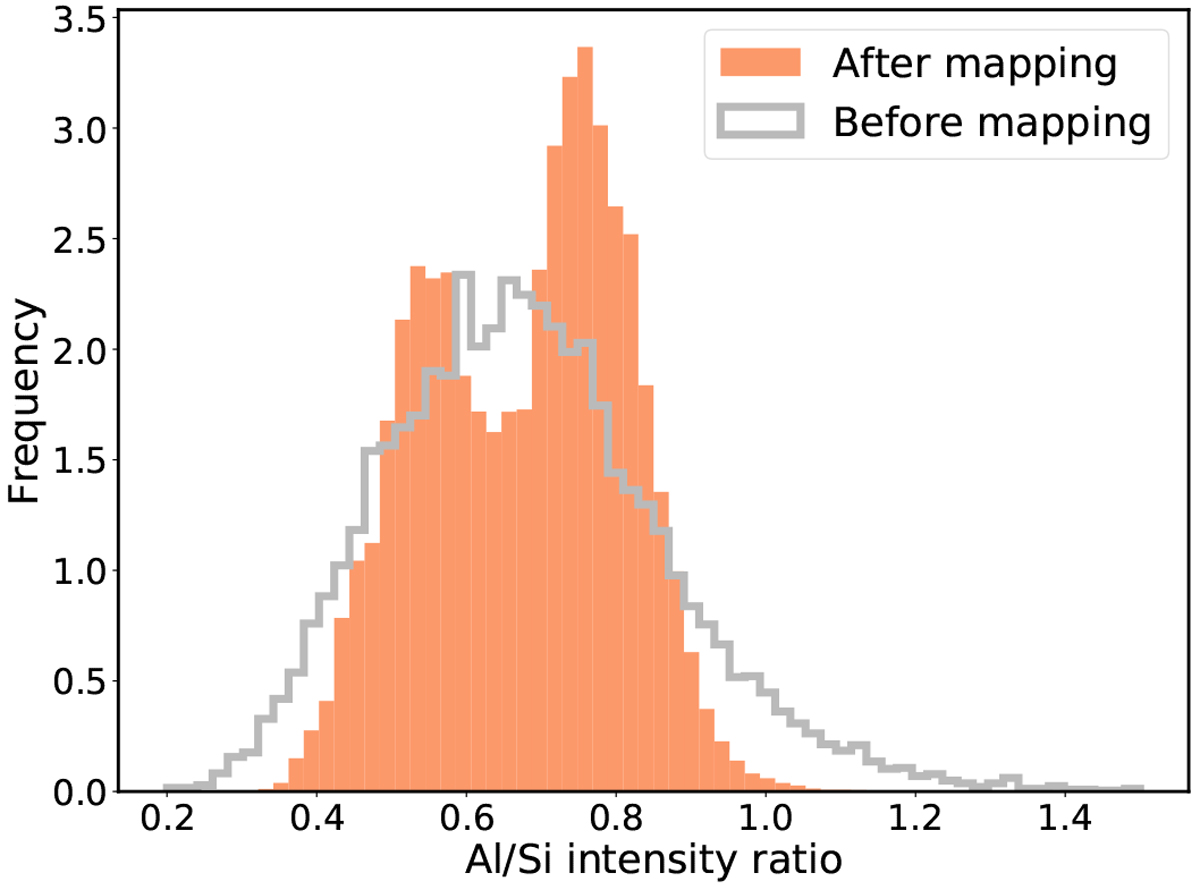
Corrected normalized frequency distribution of Al/Si intensity ratio before and after mapping. The mapping before shows all 8 s Al/Si intensity ratios measured by Apollo 15 and 16. The mapping after shows the frequency of the mean Al/Si intensity ratio stored on the constructed Lunar surface grid by taking the response into account.
Current usage metrics show cumulative count of Article Views (full-text article views including HTML views, PDF and ePub downloads, according to the available data) and Abstracts Views on Vision4Press platform.
Data correspond to usage on the plateform after 2015. The current usage metrics is available 48-96 hours after online publication and is updated daily on week days.
Initial download of the metrics may take a while.