Free Access
Fig. 5.
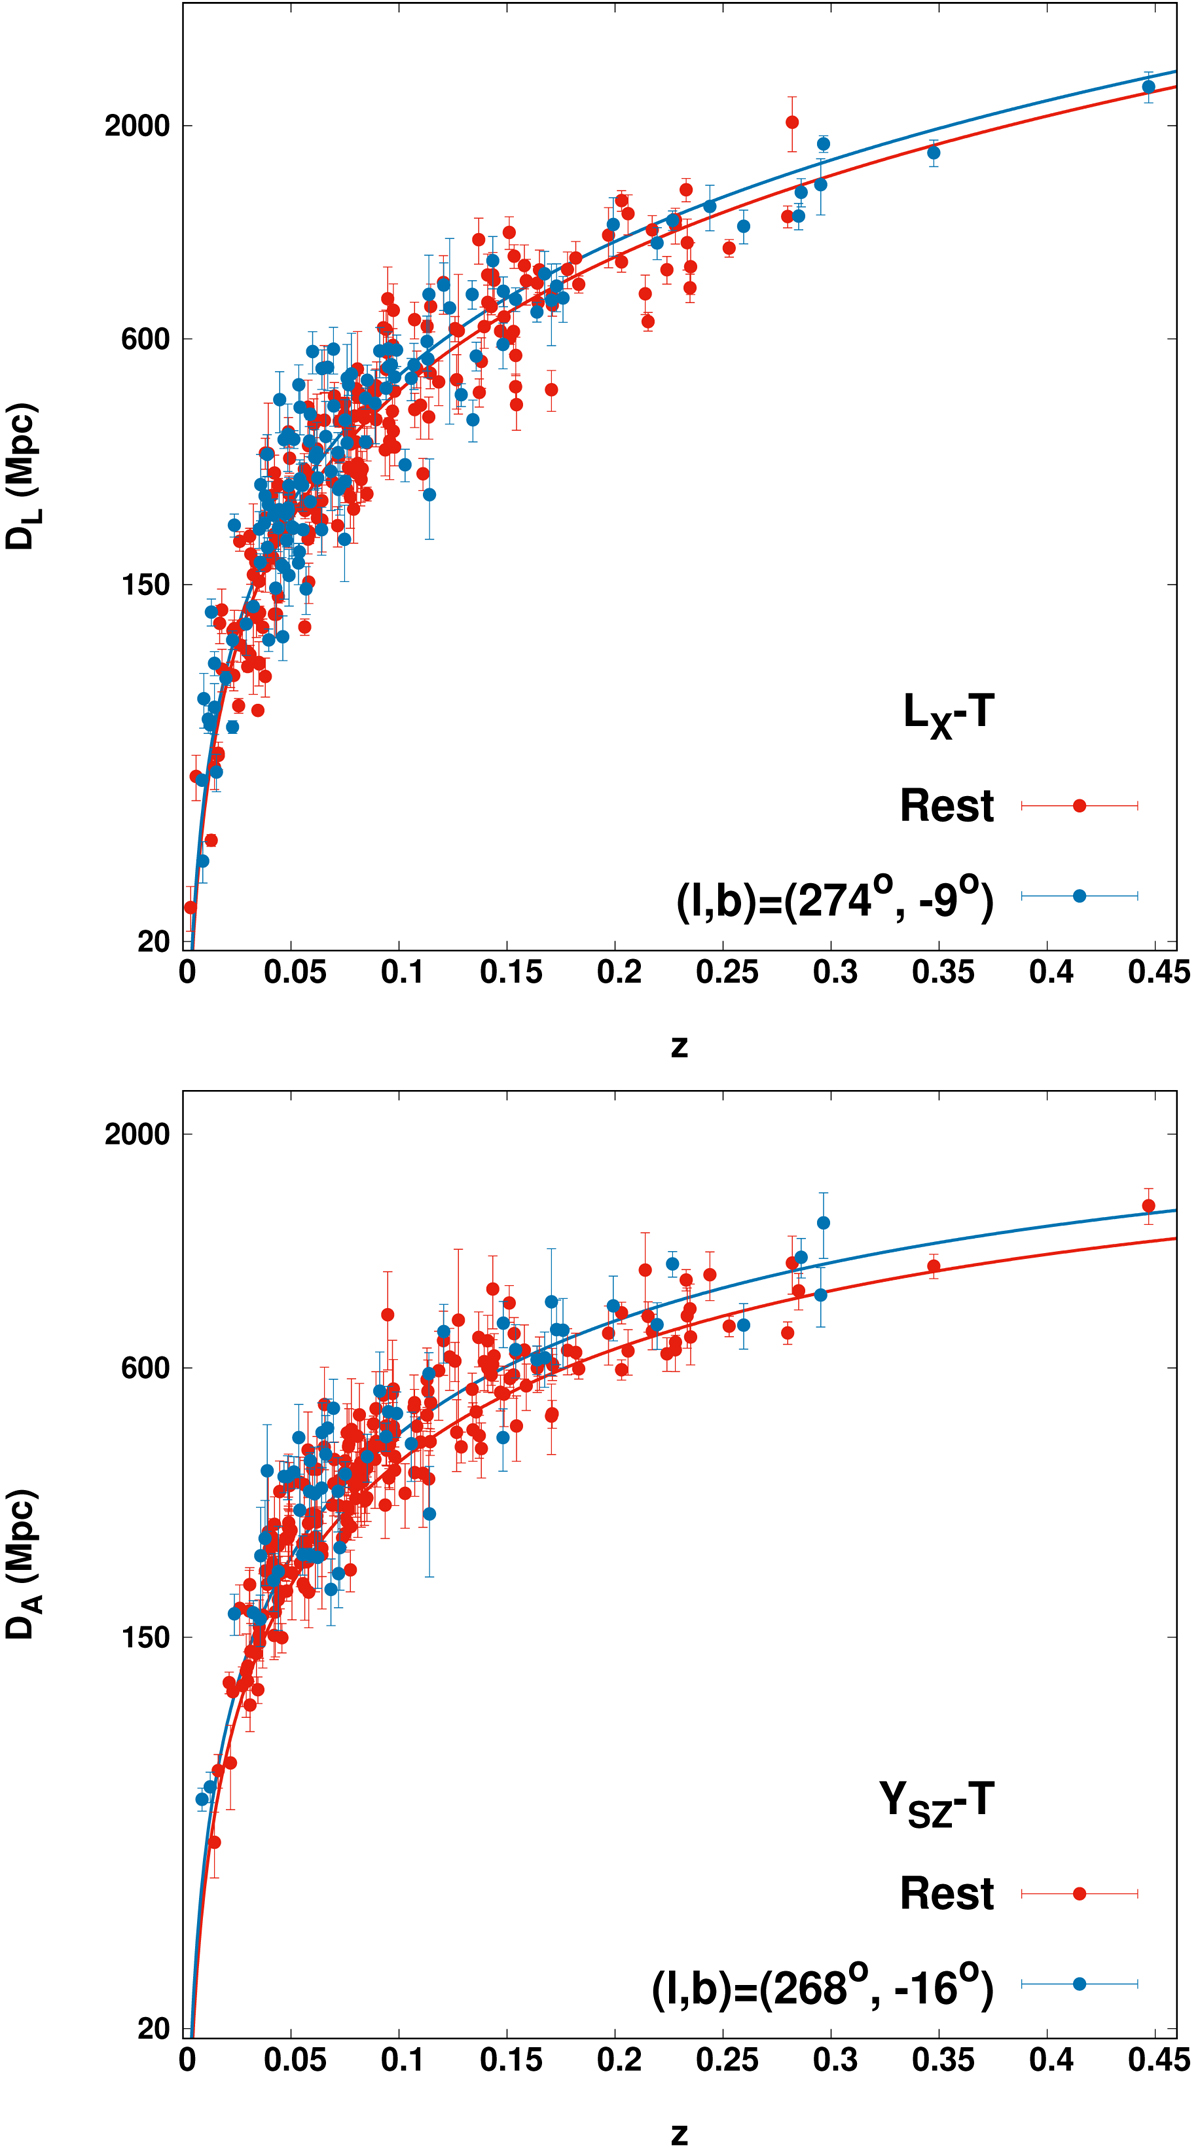
Hubble diagram of galaxy clusters as derived by the LX − T (top) and the YSZ − T (bottom) relations. The clusters from the most anisotropic region of each scaling relation are shown (blue) together with the clusters from the rest of the sky (red). The best-fit lines are indicated with the same color.
Current usage metrics show cumulative count of Article Views (full-text article views including HTML views, PDF and ePub downloads, according to the available data) and Abstracts Views on Vision4Press platform.
Data correspond to usage on the plateform after 2015. The current usage metrics is available 48-96 hours after online publication and is updated daily on week days.
Initial download of the metrics may take a while.