Fig. 3.
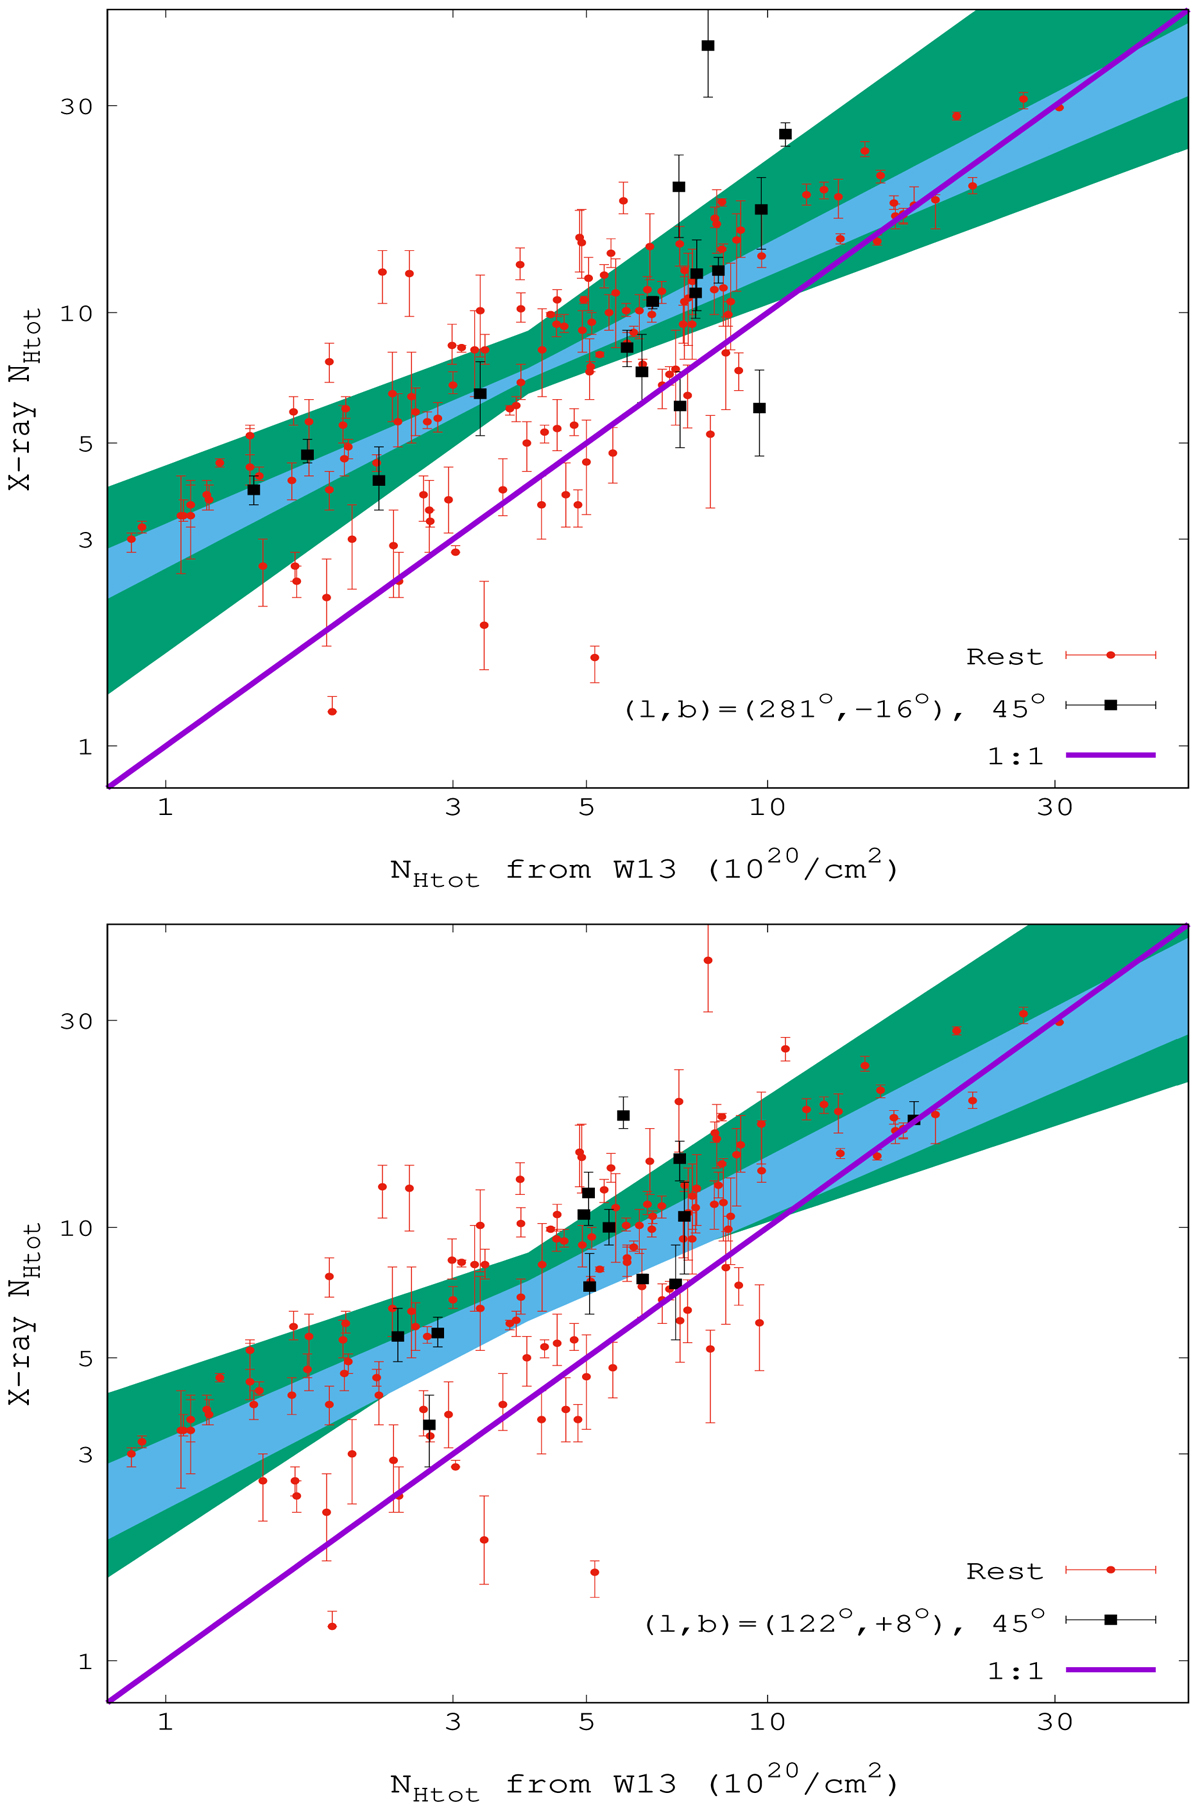
Comparison between the NHtot from W13 and the NHtot constrained by our X-ray spectral analysis. The equality line is indicated in purple; the 1σ space of the best-fit function for the region of interest (green, black points) and for the rest of the sky (cyan, red points) are also shown. The reason for the systematic difference is given in the main text. The region of interest is within 45° from (l, b)=(281°, −16°) (top) and from (l, b)=(122° , + 8°) (bottom).
Current usage metrics show cumulative count of Article Views (full-text article views including HTML views, PDF and ePub downloads, according to the available data) and Abstracts Views on Vision4Press platform.
Data correspond to usage on the plateform after 2015. The current usage metrics is available 48-96 hours after online publication and is updated daily on week days.
Initial download of the metrics may take a while.