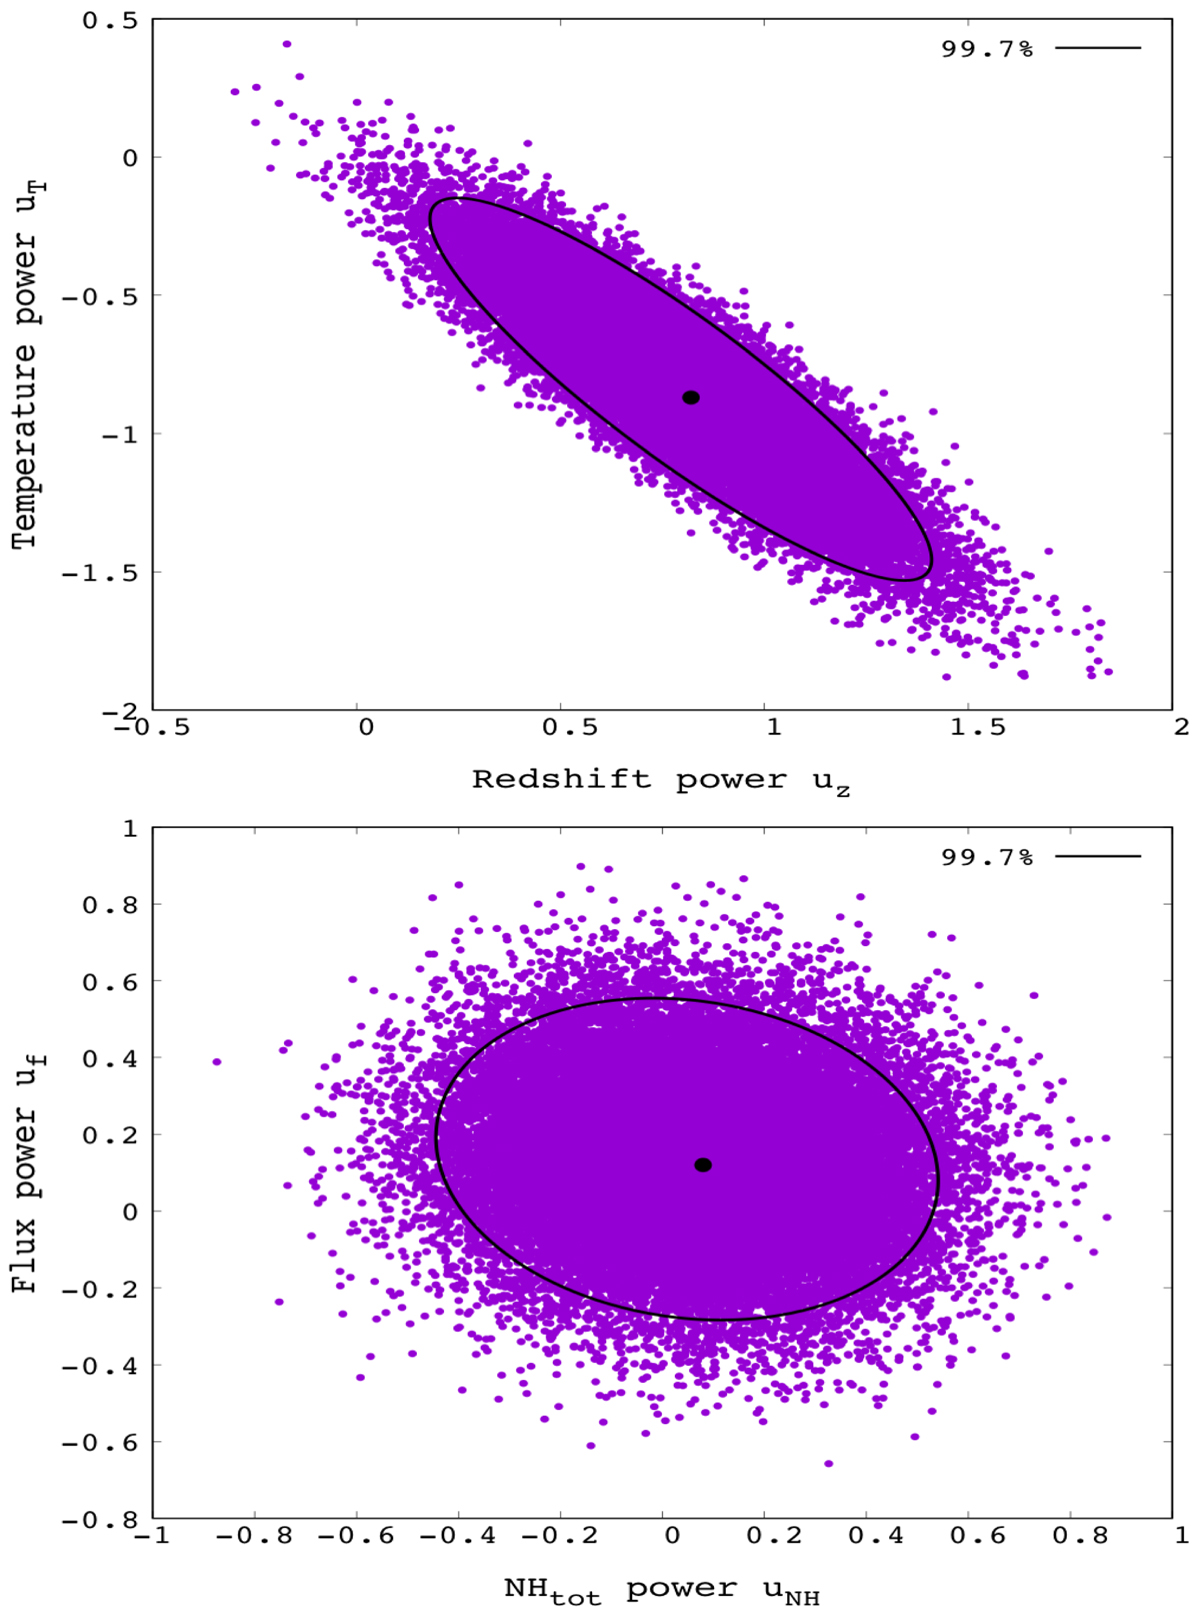
Fig. E.3.

Top: distribution of the galactic latitude of the most anisotropic regions as detected in the 10 000 isotropic simulated samples for the LX − T relation. The distance weighting during the LX − TT fitting was used. The bins close to the ZoA cover a larger portion of the sky and naturally more anisotropies are expected to be detected there even if no bias existed.
Current usage metrics show cumulative count of Article Views (full-text article views including HTML views, PDF and ePub downloads, according to the available data) and Abstracts Views on Vision4Press platform.
Data correspond to usage on the plateform after 2015. The current usage metrics is available 48-96 hours after online publication and is updated daily on week days.
Initial download of the metrics may take a while.


