Fig. D.6.
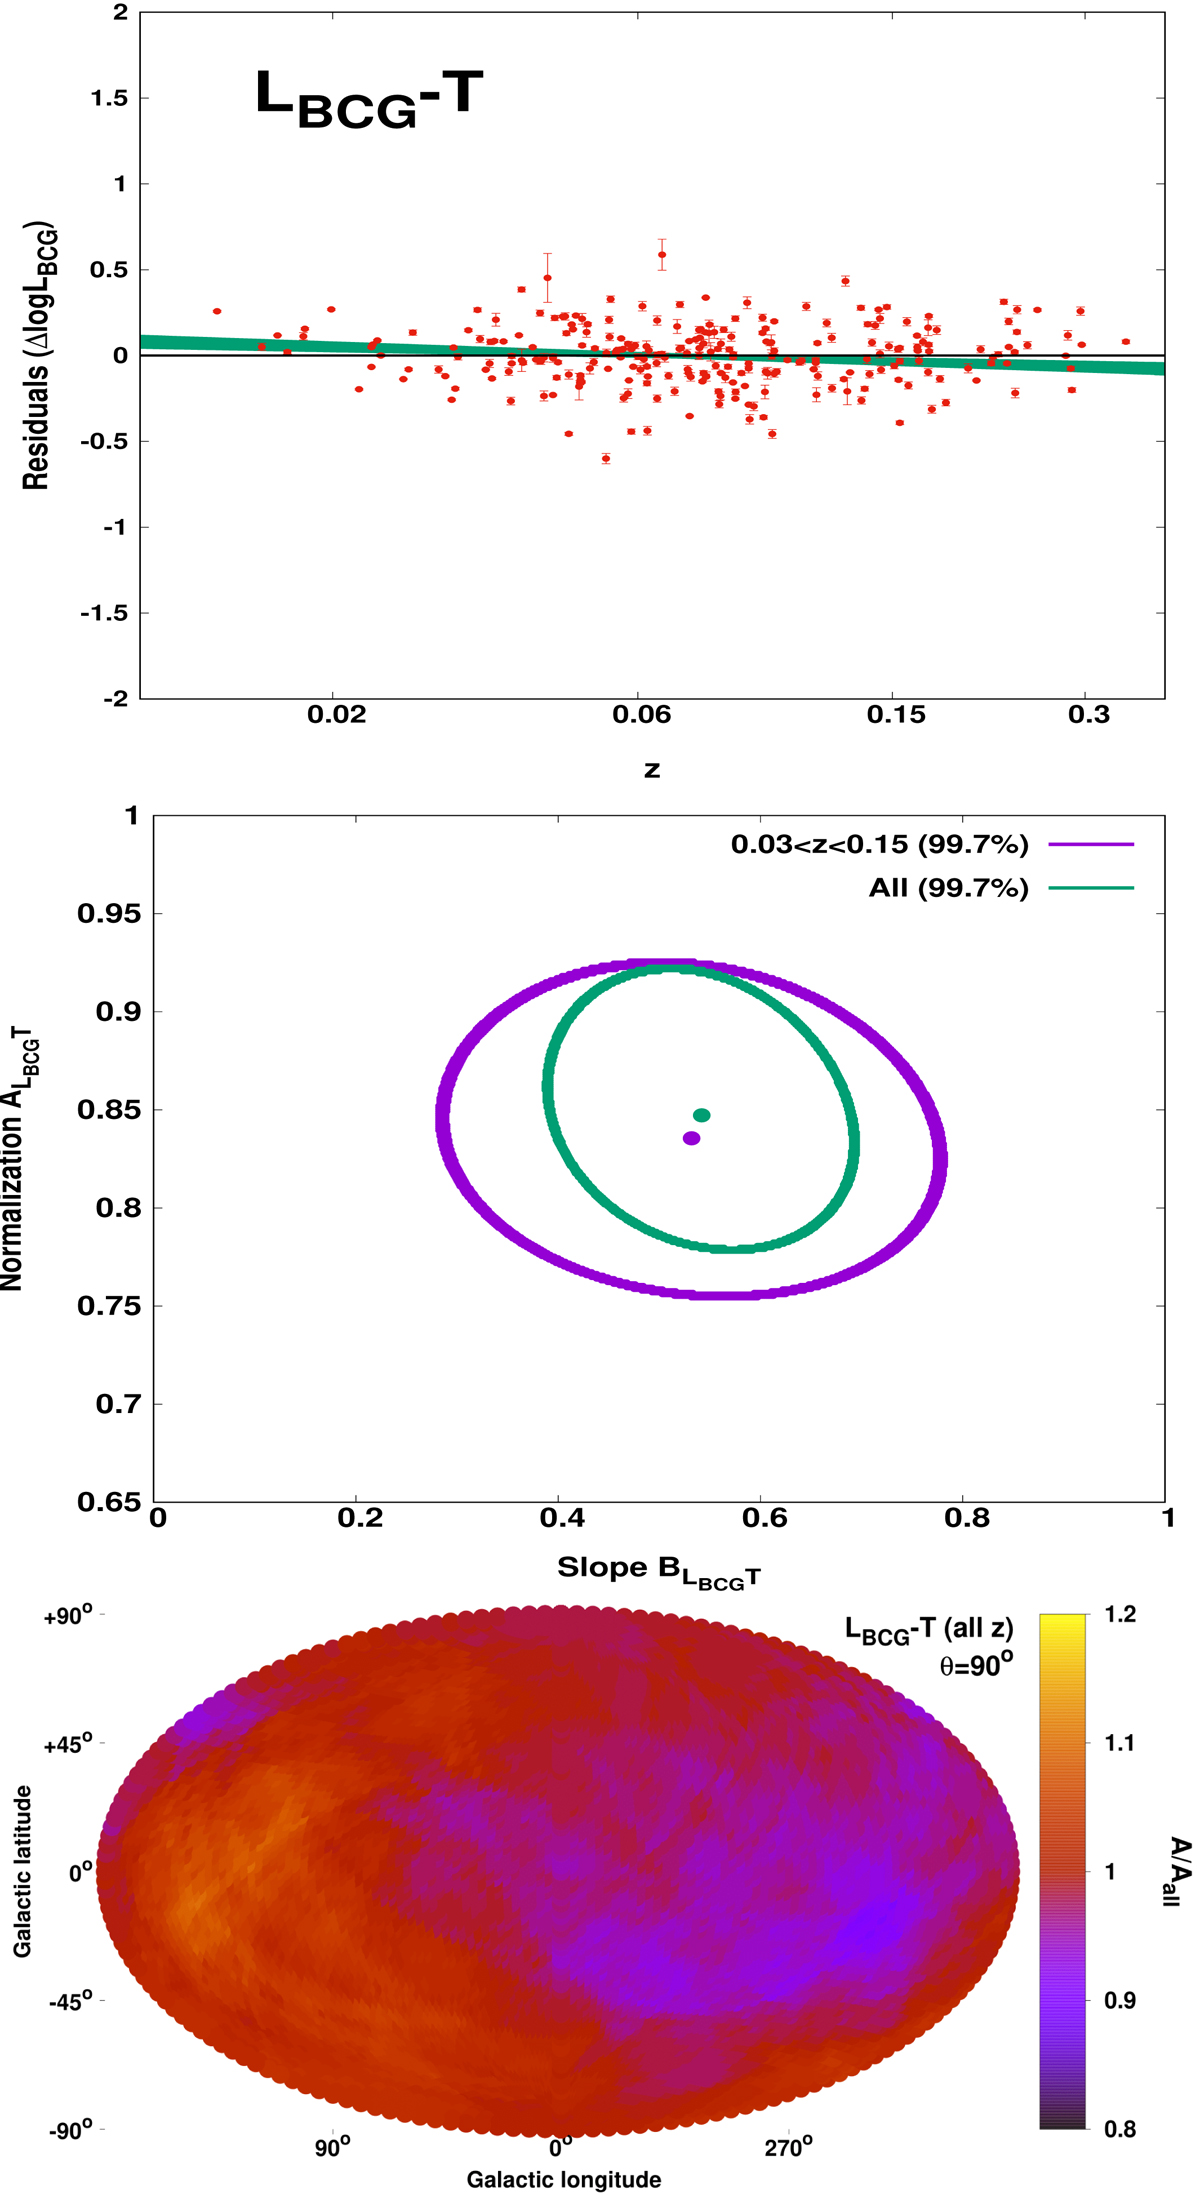
Top: LBCG residuals of the LBCG − T fit, as a function of the BCG redshift. The green stripe corresponds to the best-fit function within 1σ. Middle: 3σ (99.7%) parameter space of the normalization and slope of the LBCG − T relation, for all clusters (green), and for 0.03 < z < 0.15 clusters (purple). Bottom: normalization anisotropy map of the LBCG − T relation when all clusters are considered independent of their redshift.
Current usage metrics show cumulative count of Article Views (full-text article views including HTML views, PDF and ePub downloads, according to the available data) and Abstracts Views on Vision4Press platform.
Data correspond to usage on the plateform after 2015. The current usage metrics is available 48-96 hours after online publication and is updated daily on week days.
Initial download of the metrics may take a while.