Free Access
Fig. D.5.
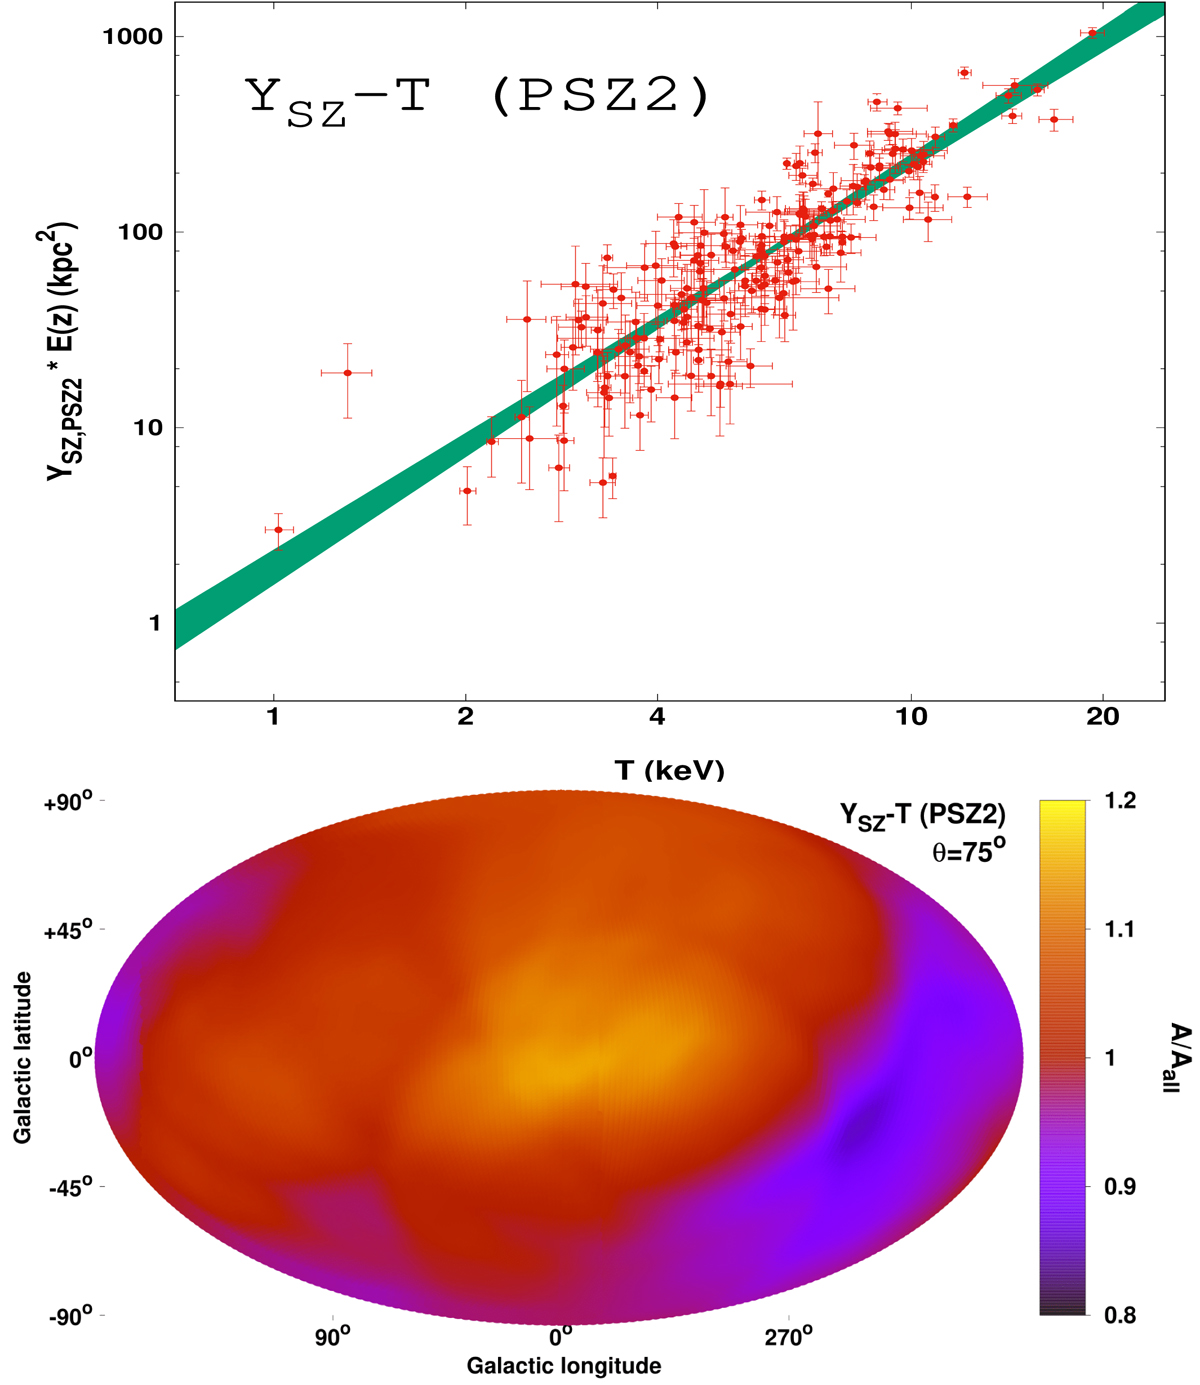
Top: YSZ − T relation when using the PSZ2 YSZ values, together with its 1σ best-fit function (green). Bottom: normalization anisotropy map of the YSZ − T relation when the PSZ2 values for YSZ are used.
Current usage metrics show cumulative count of Article Views (full-text article views including HTML views, PDF and ePub downloads, according to the available data) and Abstracts Views on Vision4Press platform.
Data correspond to usage on the plateform after 2015. The current usage metrics is available 48-96 hours after online publication and is updated daily on week days.
Initial download of the metrics may take a while.