Fig. B.1.
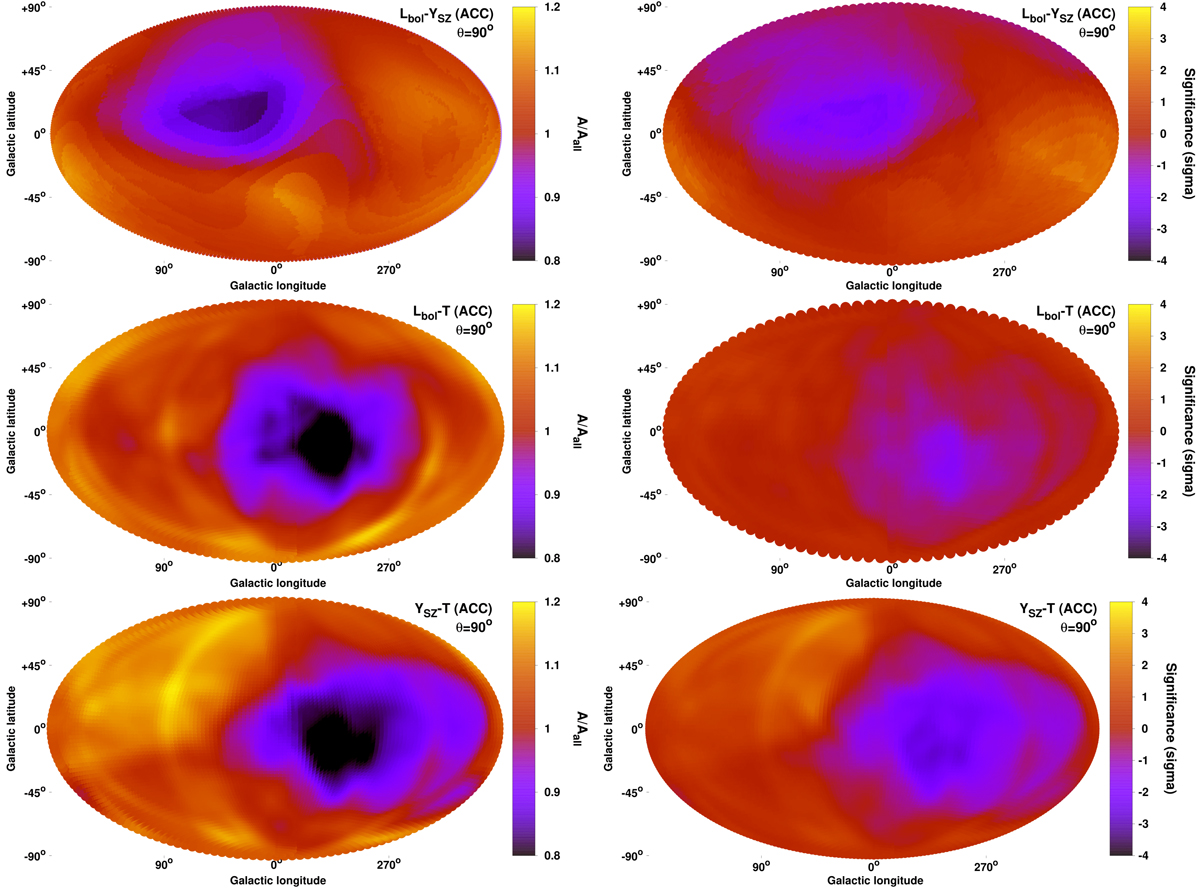
Normalization anisotropy maps and the respective statistical significance maps of the anisotropies for the Lbol − YSZ (top), the Lbol − T (middle), and the YSZ − T (bottom) scaling relations for the ACC sample. The Lbol − YSZ traces only unaccounted for X-ray absorption effects, while the LX − T and YSZ − T behavior mirrors cosmological anisotropies and BFs.
Current usage metrics show cumulative count of Article Views (full-text article views including HTML views, PDF and ePub downloads, according to the available data) and Abstracts Views on Vision4Press platform.
Data correspond to usage on the plateform after 2015. The current usage metrics is available 48-96 hours after online publication and is updated daily on week days.
Initial download of the metrics may take a while.