Fig. 13.
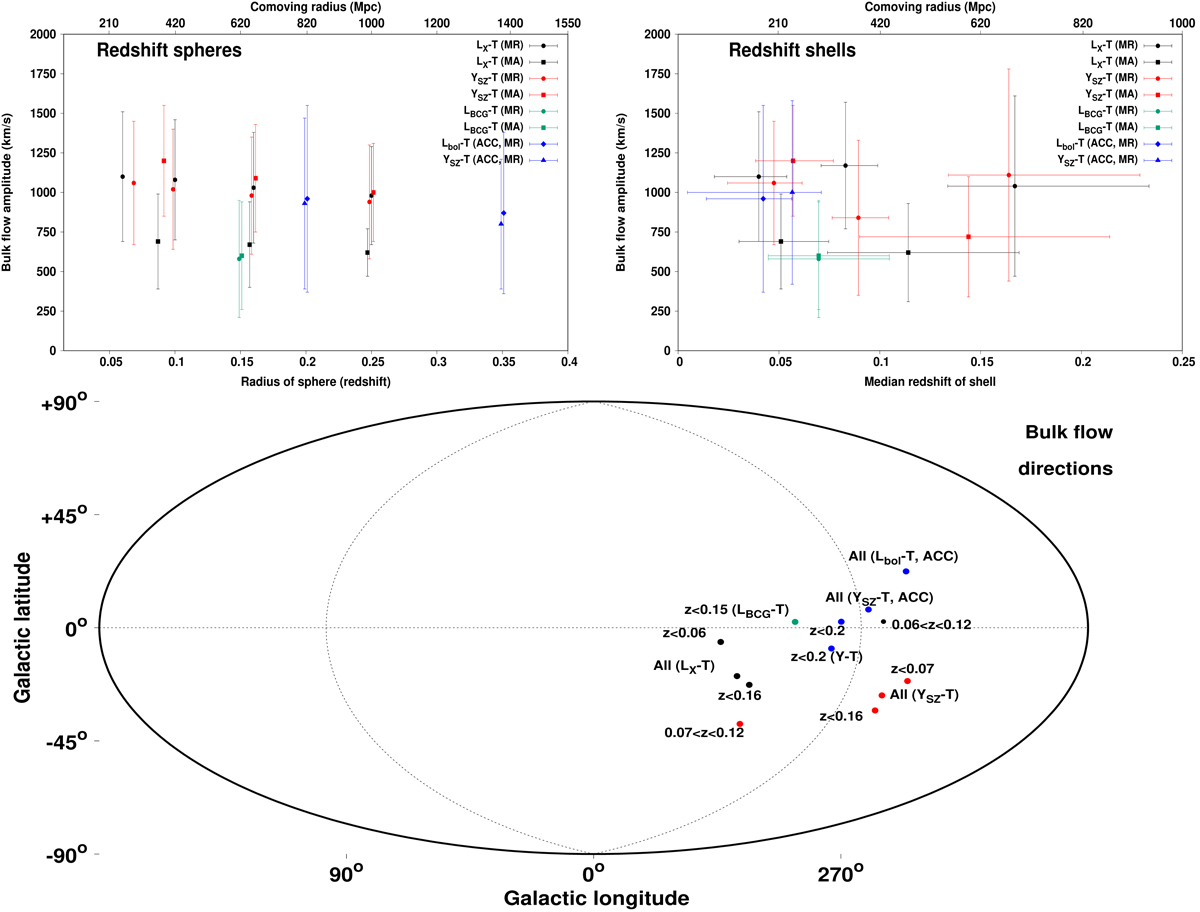
Top left: bulk flow amplitude and its 68.3% uncertainty as a function of the redshift radius of the used spherical volumes (or the comoving distance radius). Circles and squares correspond to the MR and MA methods, respectively. The black, red, and green points correspond to the LX − T, YSZ − T, and LBCG − T relations, respectively. The blue diamonds and triangles correspond to the ACC Lbol − T and YSZ − T relations, respectively. The results above z ≳ 0.16 are expected to be dominated by more local clusters and thus are overestimated. Top right: bulk flow amplitude and its 68.3% uncertainty as a function of the median redshift of each shell (or the comoving distance), together with the standard deviation of the redshift distribution. The color coding is the same as before. The data points with the same color and shape are independent to each other. Bottom: examples of BF directions as found for different redshift bins and methods. The color coding is the same as before. All directions agree with each other within 1σ.
Current usage metrics show cumulative count of Article Views (full-text article views including HTML views, PDF and ePub downloads, according to the available data) and Abstracts Views on Vision4Press platform.
Data correspond to usage on the plateform after 2015. The current usage metrics is available 48-96 hours after online publication and is updated daily on week days.
Initial download of the metrics may take a while.