Free Access
Fig. 6.
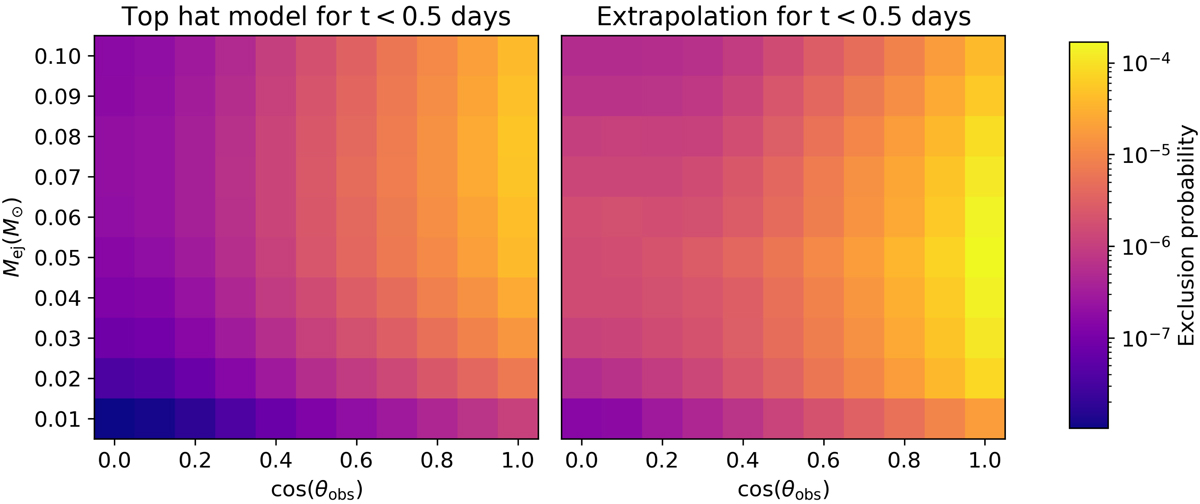
Exclusion probability of our q-band observations for KN models with varying ejecta mass and viewing angle. The left-hand plot employs a top hat model at early times (t < 0.5 days) post-merger, while the right-hand plot extrapolates the model light curves using a cubic spline.
Current usage metrics show cumulative count of Article Views (full-text article views including HTML views, PDF and ePub downloads, according to the available data) and Abstracts Views on Vision4Press platform.
Data correspond to usage on the plateform after 2015. The current usage metrics is available 48-96 hours after online publication and is updated daily on week days.
Initial download of the metrics may take a while.