Free Access
Fig. 5.
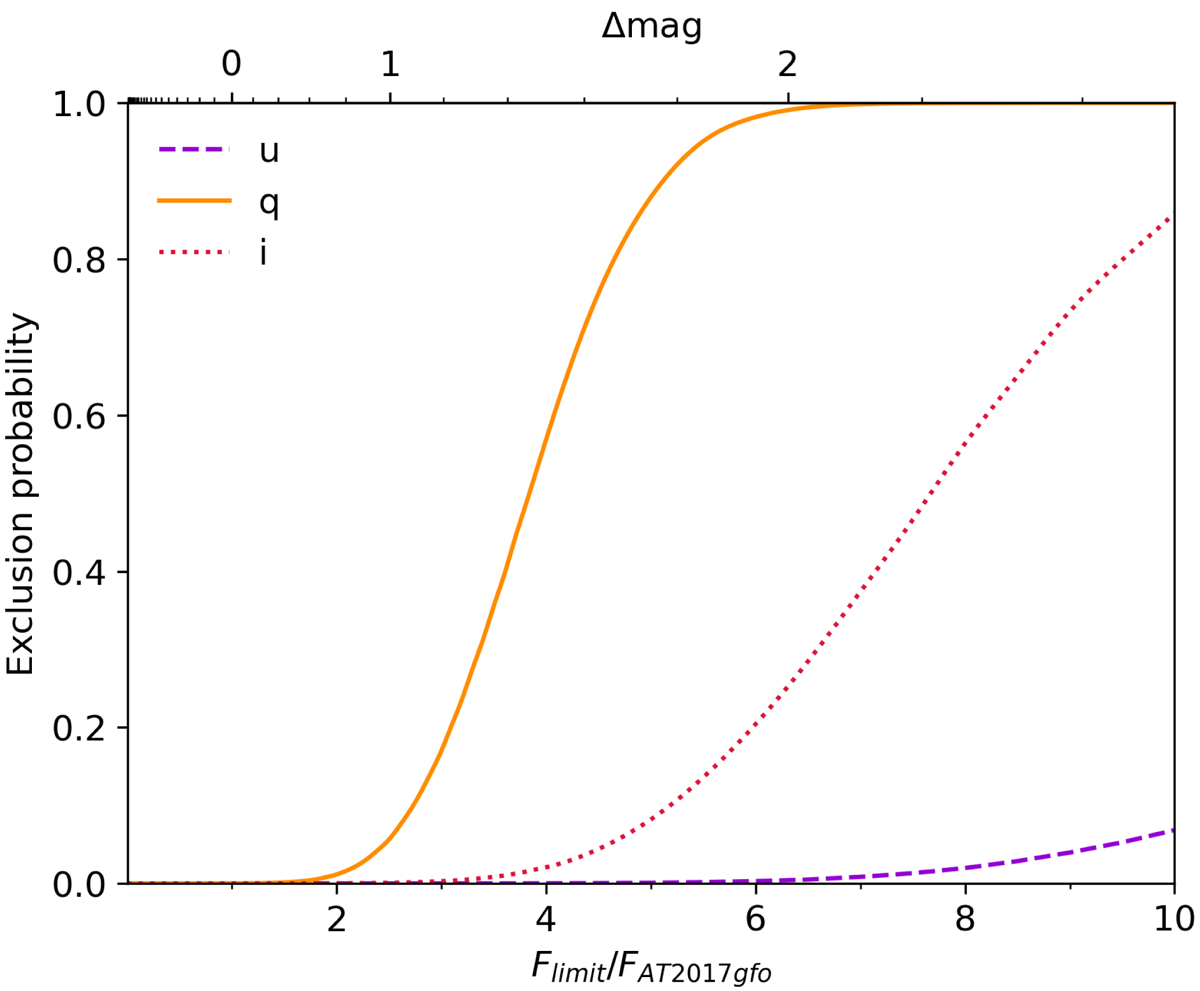
Exclusion probability of our observations as a function of scaled AT2017gfo-like KN flux (bottom axis) and corresponding vertical shift of the light curves in Fig. 4 in magnitudes (top axis). An x-value of 1 corresponds to an AT2017gfo KN at the distance of GW190814.
Current usage metrics show cumulative count of Article Views (full-text article views including HTML views, PDF and ePub downloads, according to the available data) and Abstracts Views on Vision4Press platform.
Data correspond to usage on the plateform after 2015. The current usage metrics is available 48-96 hours after online publication and is updated daily on week days.
Initial download of the metrics may take a while.