Free Access
Fig. 4.
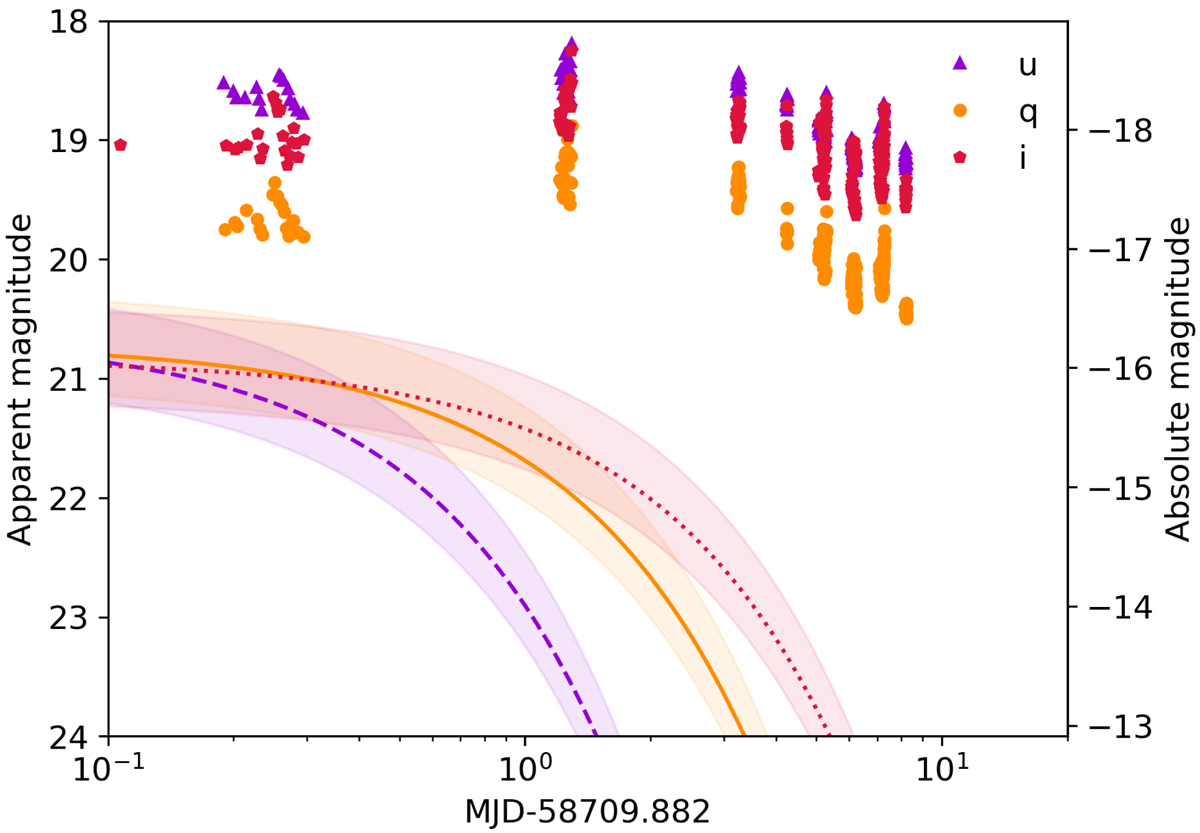
Phenomenological fits to the AT2017gfo light curve (with u dashed, q smooth and i dotted) shown in relation to the MeerLICHT 5σ limiting magnitudes. The shaded regions indicate the 1σ distance uncertainties. Apparent magnitudes were converted to absolute magnitudes using M = m − 5log10(dL/10 pc) at the distance of GW190814.
Current usage metrics show cumulative count of Article Views (full-text article views including HTML views, PDF and ePub downloads, according to the available data) and Abstracts Views on Vision4Press platform.
Data correspond to usage on the plateform after 2015. The current usage metrics is available 48-96 hours after online publication and is updated daily on week days.
Initial download of the metrics may take a while.