Fig. 7.
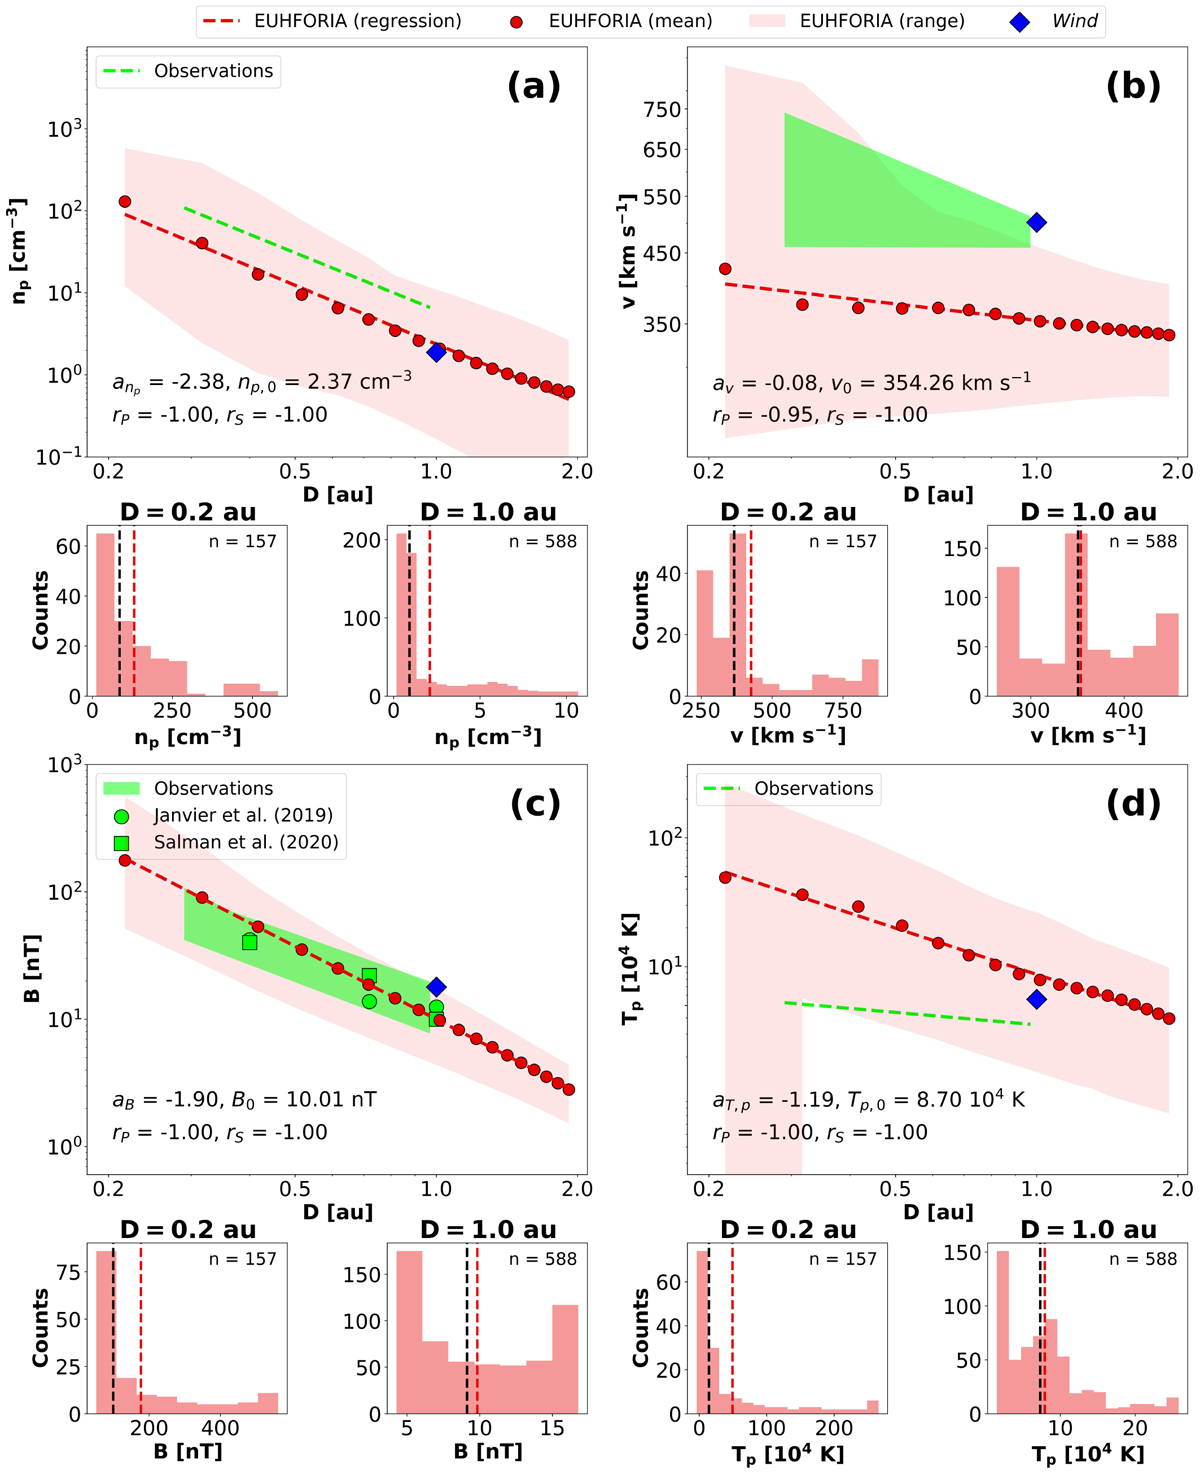
Radial dependence of the mean CME parameters in EUHFORIA, extracted at virtual spacecraft located along the Sun–Earth line (red dots): (a) speed ⟨v⟩CME; (b) proton number density ⟨np⟩CME; (c) magnetic field ⟨B⟩CME; (d) proton temperature ⟨Tp⟩CME. The red shaded areas show the maximum variation of EUHFORIA predictions as a function of the heliocentric distance. The results from the fitting of the mean values are indicated as dashed red lines. Observation-based relations are indicated as dashed green lines or green shaded areas. Observation-based values at selected heliocentric distances are indicated as green dots. Mean values from Wind are shown as blue diamonds. Histograms showing the frequency of occurrence of each parameter are provided for D = 0.2 au and D = 1.0 au radial distances. The mean and median are indicated by the red and black vertical dashed lines, respectively.
Current usage metrics show cumulative count of Article Views (full-text article views including HTML views, PDF and ePub downloads, according to the available data) and Abstracts Views on Vision4Press platform.
Data correspond to usage on the plateform after 2015. The current usage metrics is available 48-96 hours after online publication and is updated daily on week days.
Initial download of the metrics may take a while.