Fig. 4.
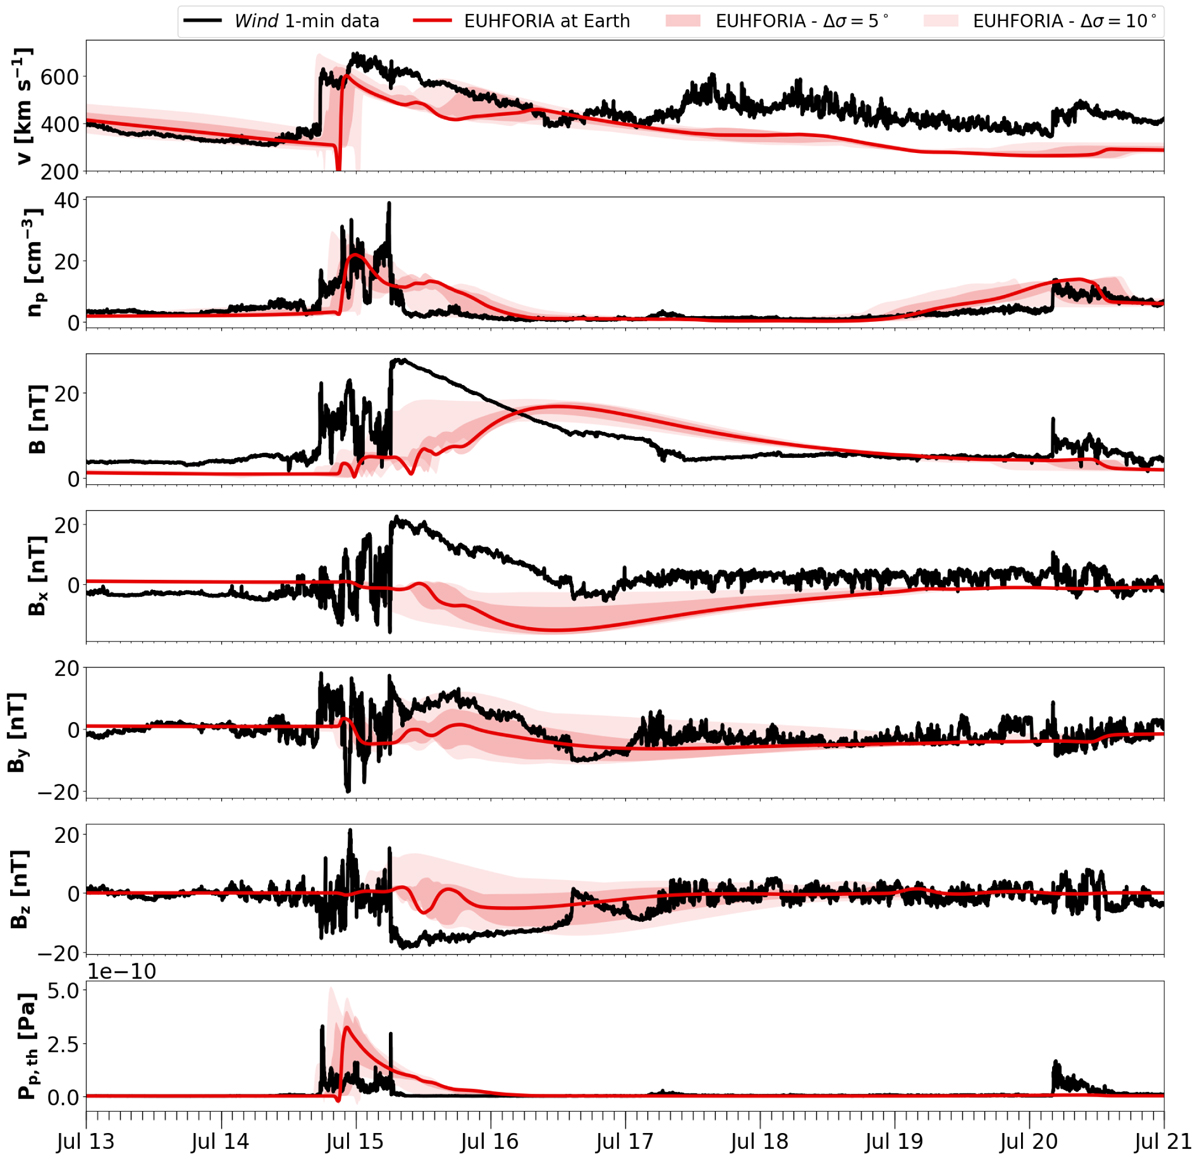
Comparison of 10 min cadence EUHFORIA predictions at Earth (red solid line) and 1 min averaged Wind proton data (black solid line). The dark red and light red shaded areas show the maximum variation of EUHFORIA predictions at virtual spacecraft separated by Δσ = 5° and Δσ = 10° in longitude and/or latitude from Earth. From top to bottom: speed (v), proton number density (np), magnetic field magnitude (B), magnetic field components in GSE coordinates (Bx, By, Bz), and proton thermal pressure (Pp, th).
Current usage metrics show cumulative count of Article Views (full-text article views including HTML views, PDF and ePub downloads, according to the available data) and Abstracts Views on Vision4Press platform.
Data correspond to usage on the plateform after 2015. The current usage metrics is available 48-96 hours after online publication and is updated daily on week days.
Initial download of the metrics may take a while.