Fig. A.3.
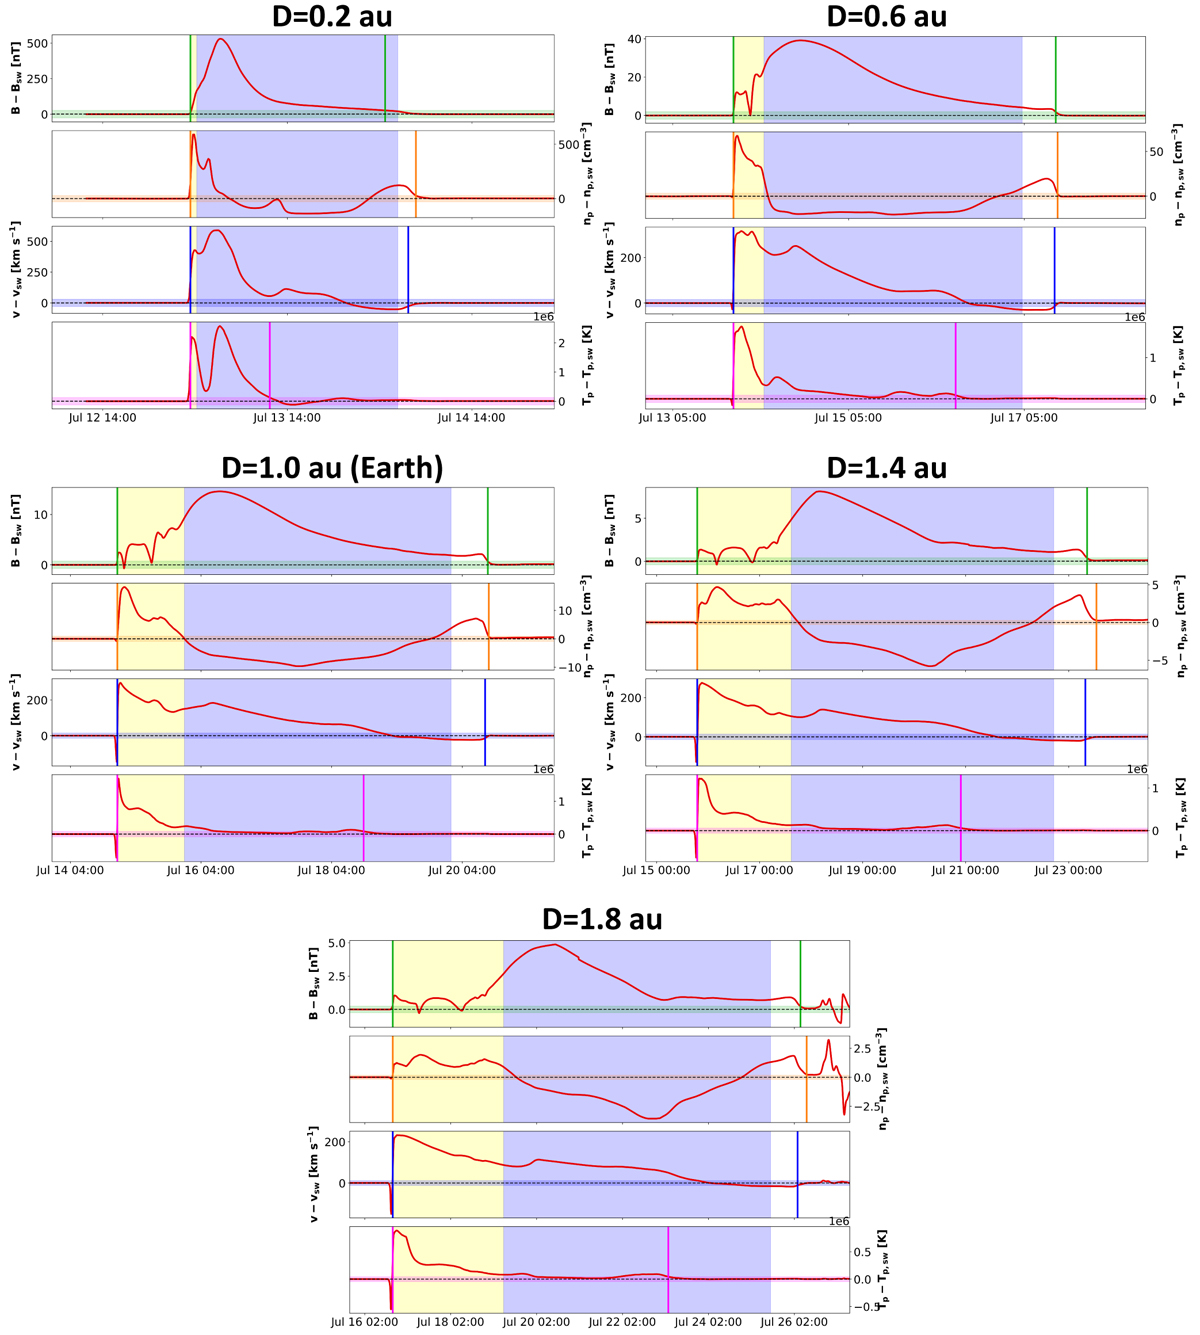
Identification of the start and end of the CME perturbation to the background solar wind based on the 5% threshold (marked by the coloured horizontal rectangles in each panel) in EUHFORIA time series at various heliocentric distances. The CME wake for each variable is marked by the coloured vertical lines. The period of the sheath and CME passage (same as in Fig. A.2) are marked as yellow and blue shaded areas, respectively.
Current usage metrics show cumulative count of Article Views (full-text article views including HTML views, PDF and ePub downloads, according to the available data) and Abstracts Views on Vision4Press platform.
Data correspond to usage on the plateform after 2015. The current usage metrics is available 48-96 hours after online publication and is updated daily on week days.
Initial download of the metrics may take a while.