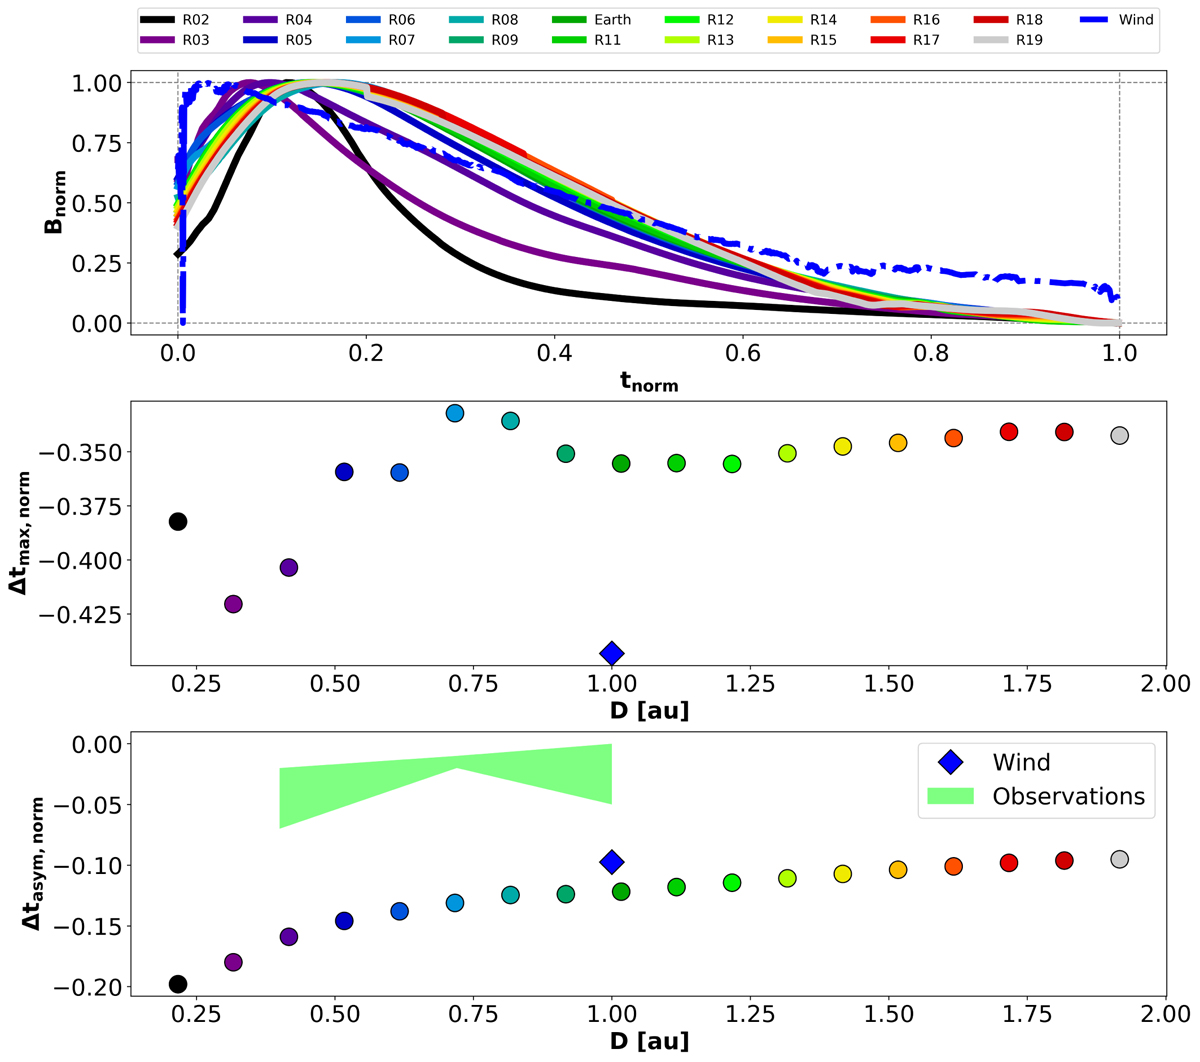
Fig. 12.

CME magnetic field profile evolution as a function of D, based on EUHFORIA simulations. Top panel: CME magnetic field profile in EUHFORIA at various heliocentric distances, expressed in terms of the normalised magnetic field Bnorm as a function of the normalised time tnorm. The normalised magnetic field profile at Wind is indicated by the dashed-dotted blue line. Middle panel: normalised time shift between the magnetic field peak and the centre of the magnetic ejecta ΔtBpeak, norm, as a function of the heliocentric distances. The observed value at Wind is indicated as a blue diamond. Bottom panel: normalised asymmetry parameter Δtasym, norm for the magnetic field profile, as a function of the heliocentric distances. The green shaded area indicates the range of asymmetry of the mean CME profiles at different heliocentric distances, based on the results by Janvier et al. (2019). The observed value at Wind is indicated as a blue diamond.
Current usage metrics show cumulative count of Article Views (full-text article views including HTML views, PDF and ePub downloads, according to the available data) and Abstracts Views on Vision4Press platform.
Data correspond to usage on the plateform after 2015. The current usage metrics is available 48-96 hours after online publication and is updated daily on week days.
Initial download of the metrics may take a while.


