Fig. 10.
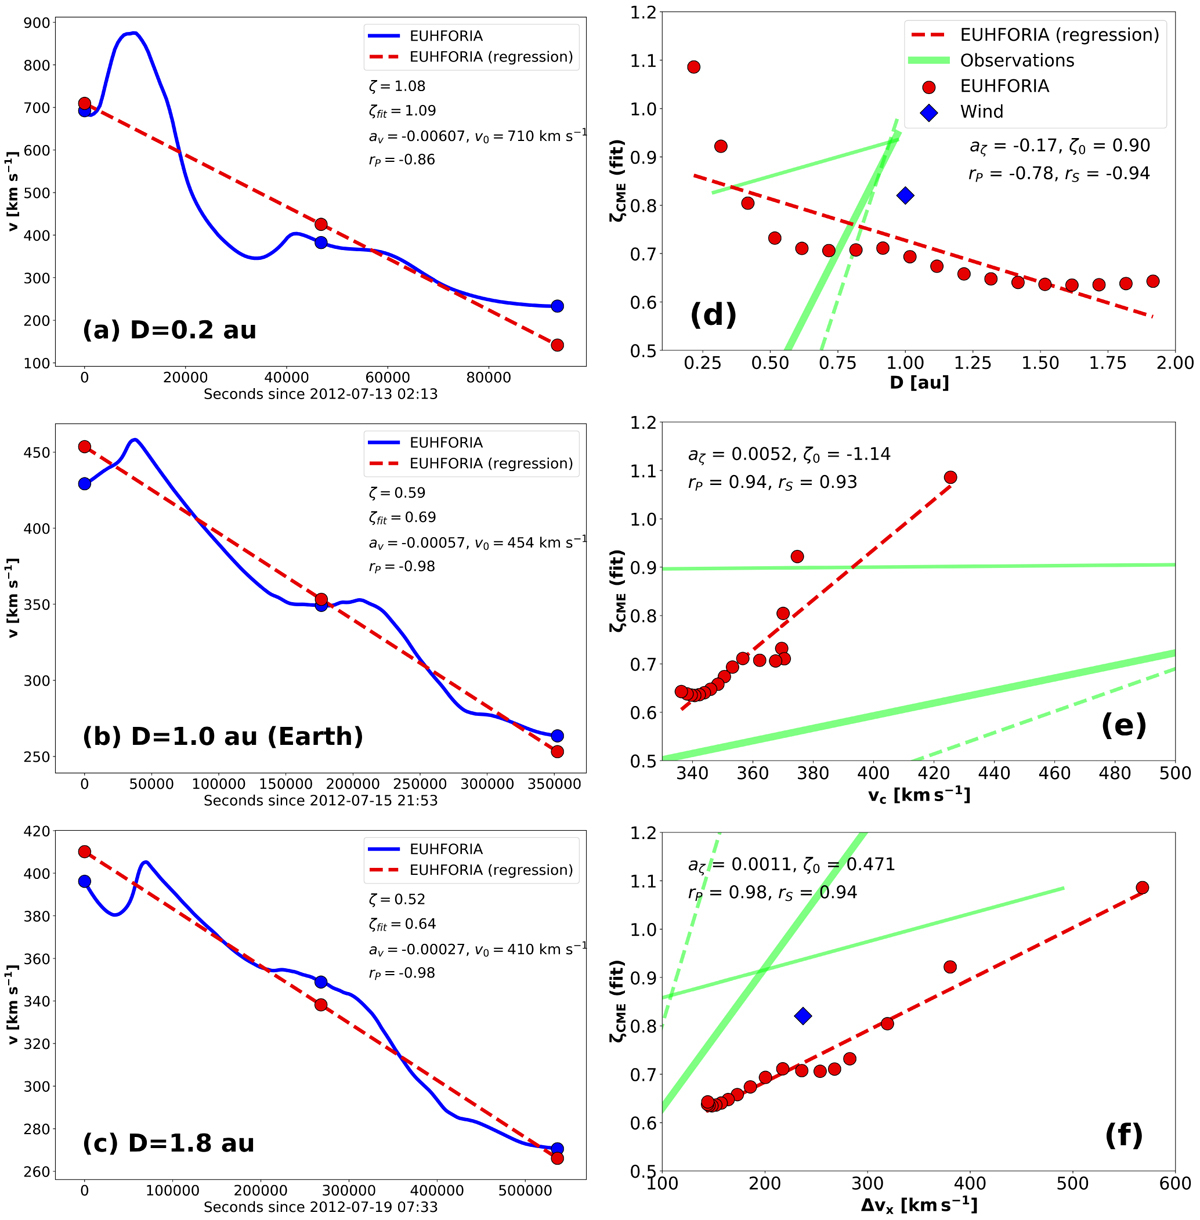
Non-dimensional CME expansion rate evolution based on EUHFORIA simulations. Left column: derivation of the non-dimensional CME expansion rate ζ from the linear fitting of the CME speed profile in EUHFORIA simulations at D = 0.2 au (a), D = 1.0 au (b), and D = 1.8 au (c). Right column: non-dimensional CME expansion rate ζCME as a function of D (d), vc, CME (e), and Δvx, CME (f). Values observed at Wind are shown as blue diamonds. The green lines represent the fit for perturbed CMEs (dashed line), non-perturbed CME (thin continuous line) and for both sets of CMEs (thick continuous line) as reported by Gulisano et al. (2010).
Current usage metrics show cumulative count of Article Views (full-text article views including HTML views, PDF and ePub downloads, according to the available data) and Abstracts Views on Vision4Press platform.
Data correspond to usage on the plateform after 2015. The current usage metrics is available 48-96 hours after online publication and is updated daily on week days.
Initial download of the metrics may take a while.