Free Access
Fig. 9
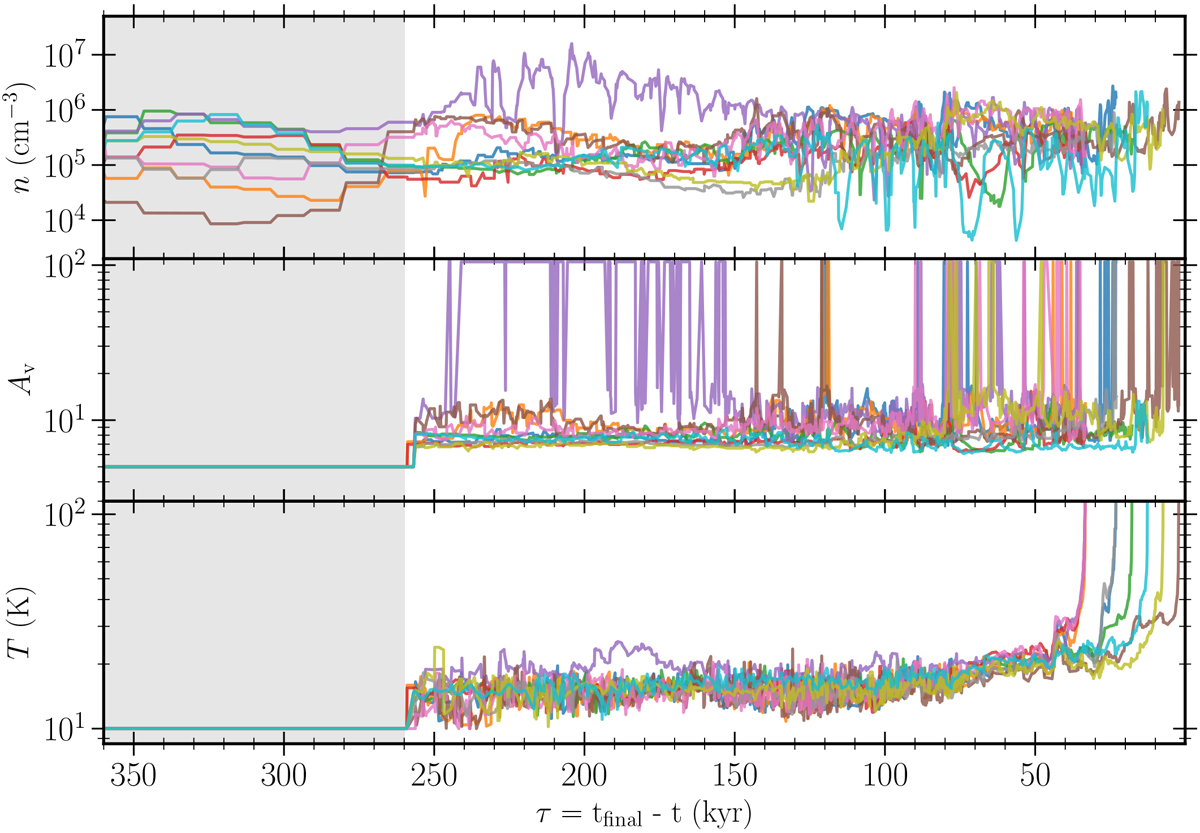
Evolution in density, Av, and temperature for the ten tracer particles shown in Fig. 8. The shaded region indicates the 100 kyr pre-collapse phase, before the protostar is formed. In the pre-collapse phase, the densities are averaged in 10 kyr windows, to reduce simulation time.
Current usage metrics show cumulative count of Article Views (full-text article views including HTML views, PDF and ePub downloads, according to the available data) and Abstracts Views on Vision4Press platform.
Data correspond to usage on the plateform after 2015. The current usage metrics is available 48-96 hours after online publication and is updated daily on week days.
Initial download of the metrics may take a while.