Fig. 6
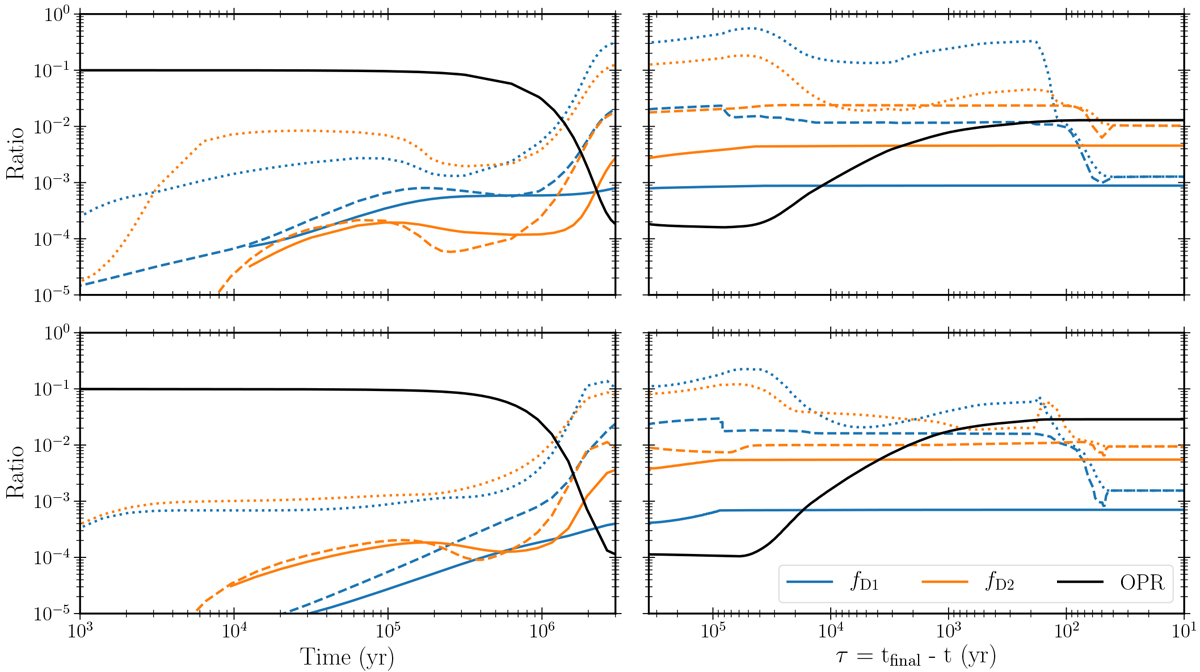
Comparison between the chemical models presented in Furuya et al. (2016) (top panels) and the model utilized here (bottom panels). The 1D RHD simulations of a protostellar collapse are from Masunaga & Inutsuka (2000). The solid lines indicate the ice mantle, the dashed lines present the ice surface, and the dotted lines show the gas-phase ratios in the three-phase models. The log-scale on the x-axis is reversed on the second row.
Current usage metrics show cumulative count of Article Views (full-text article views including HTML views, PDF and ePub downloads, according to the available data) and Abstracts Views on Vision4Press platform.
Data correspond to usage on the plateform after 2015. The current usage metrics is available 48-96 hours after online publication and is updated daily on week days.
Initial download of the metrics may take a while.