Fig. D.2
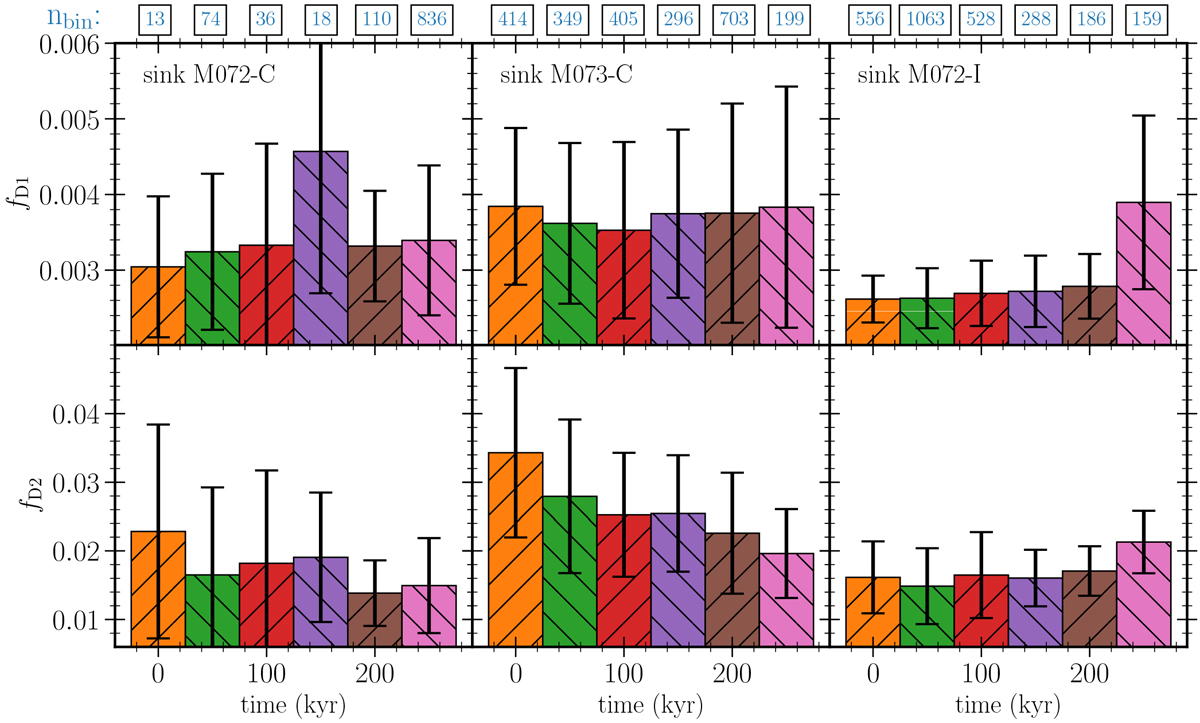
Similar to Fig. 11, with an ambient cloud extinction of 2 mag. HDO/H2O (fD1) and D2 O/HDO (fD2) ratios toward three protostars in the simulation, with similar final mass of ~ 0.7 M⊙. Tracer particles are binned according to the time at which they reach the hot corino, in bins with a width of 50 kyr. Time corresponds to the time after the onset of collapse, t0. Each bar shows the median values of tracer particles accreted in the time interval, and the error shows the [15.9, 84.1] percentiles. The number of tracer particles within each bin is denoted in blue above the first row.
Current usage metrics show cumulative count of Article Views (full-text article views including HTML views, PDF and ePub downloads, according to the available data) and Abstracts Views on Vision4Press platform.
Data correspond to usage on the plateform after 2015. The current usage metrics is available 48-96 hours after online publication and is updated daily on week days.
Initial download of the metrics may take a while.