Free Access
Fig. C.1
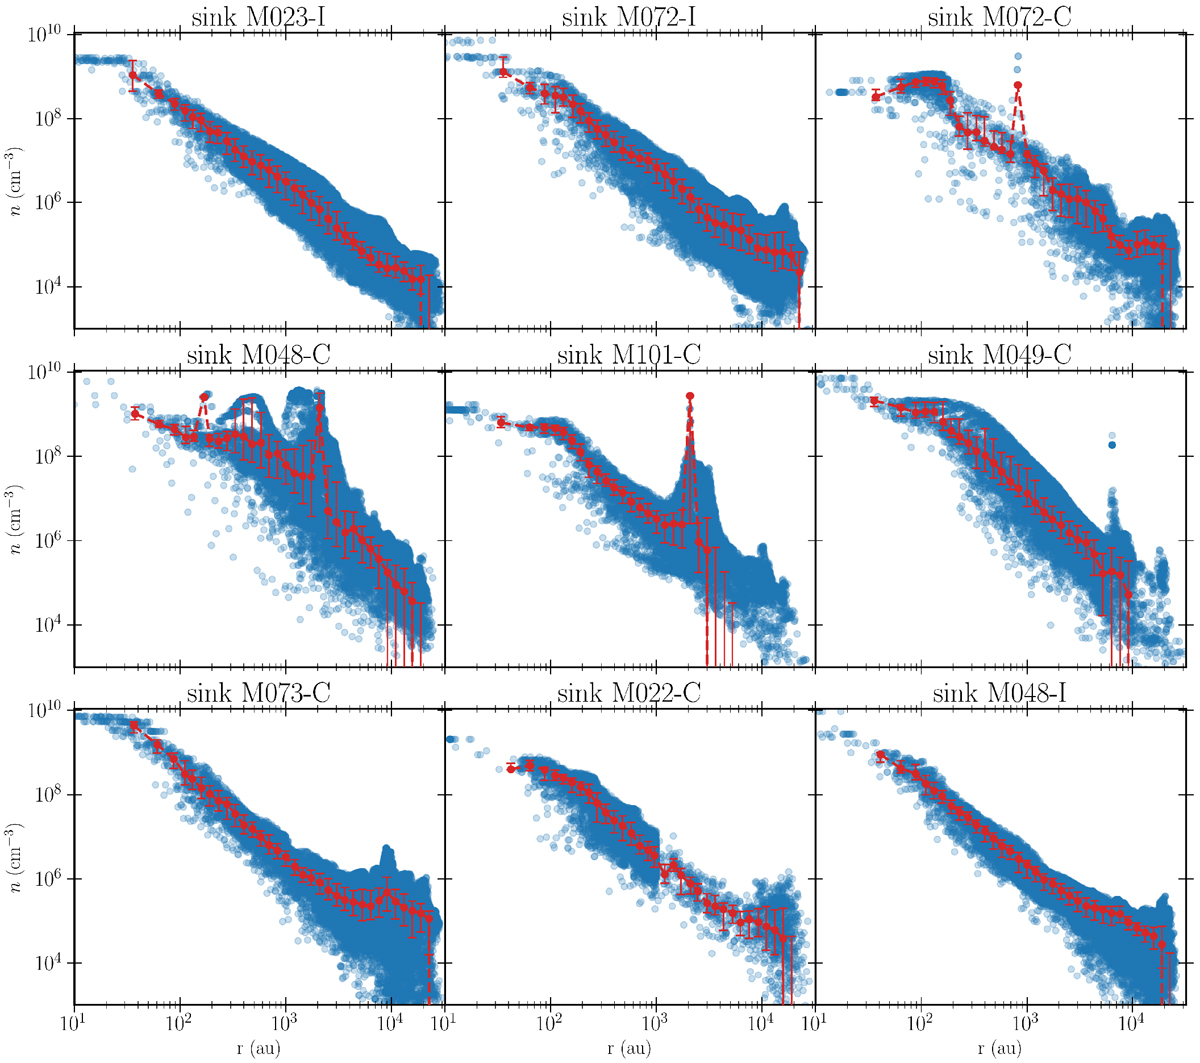
Radial density profile for 40 000 tracer particle for the sinks studied in this work. The red line shows the median in each radial bin, while the errorbars show the 25 and 75 percentiles for each bin. Blue circles indicates individual tracer particles.
Current usage metrics show cumulative count of Article Views (full-text article views including HTML views, PDF and ePub downloads, according to the available data) and Abstracts Views on Vision4Press platform.
Data correspond to usage on the plateform after 2015. The current usage metrics is available 48-96 hours after online publication and is updated daily on week days.
Initial download of the metrics may take a while.