Fig. 9.
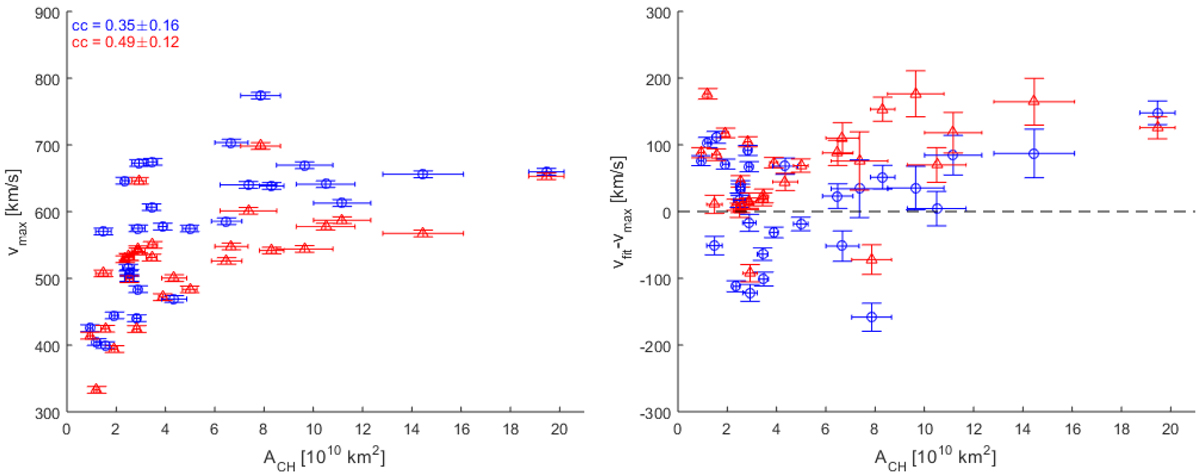
Left: maximum in situ measured SW speed vs. CH area. Right: absolute difference between the fitted value and the measurements, with a black dashed line indicating zero difference. The blue circles denote data points related to Earth, the red triangles denote data points related to Mars. The respective colors are also used for the correlation coefficient values given in the legend. The error of the CH area scales with the uncertainty of extraction; for instance, CHs that lie close to the solar limb have a larger error. The error of the measured maximum bulk velocity was set to ±5 km s−1.
Current usage metrics show cumulative count of Article Views (full-text article views including HTML views, PDF and ePub downloads, according to the available data) and Abstracts Views on Vision4Press platform.
Data correspond to usage on the plateform after 2015. The current usage metrics is available 48-96 hours after online publication and is updated daily on week days.
Initial download of the metrics may take a while.