Fig. 8.
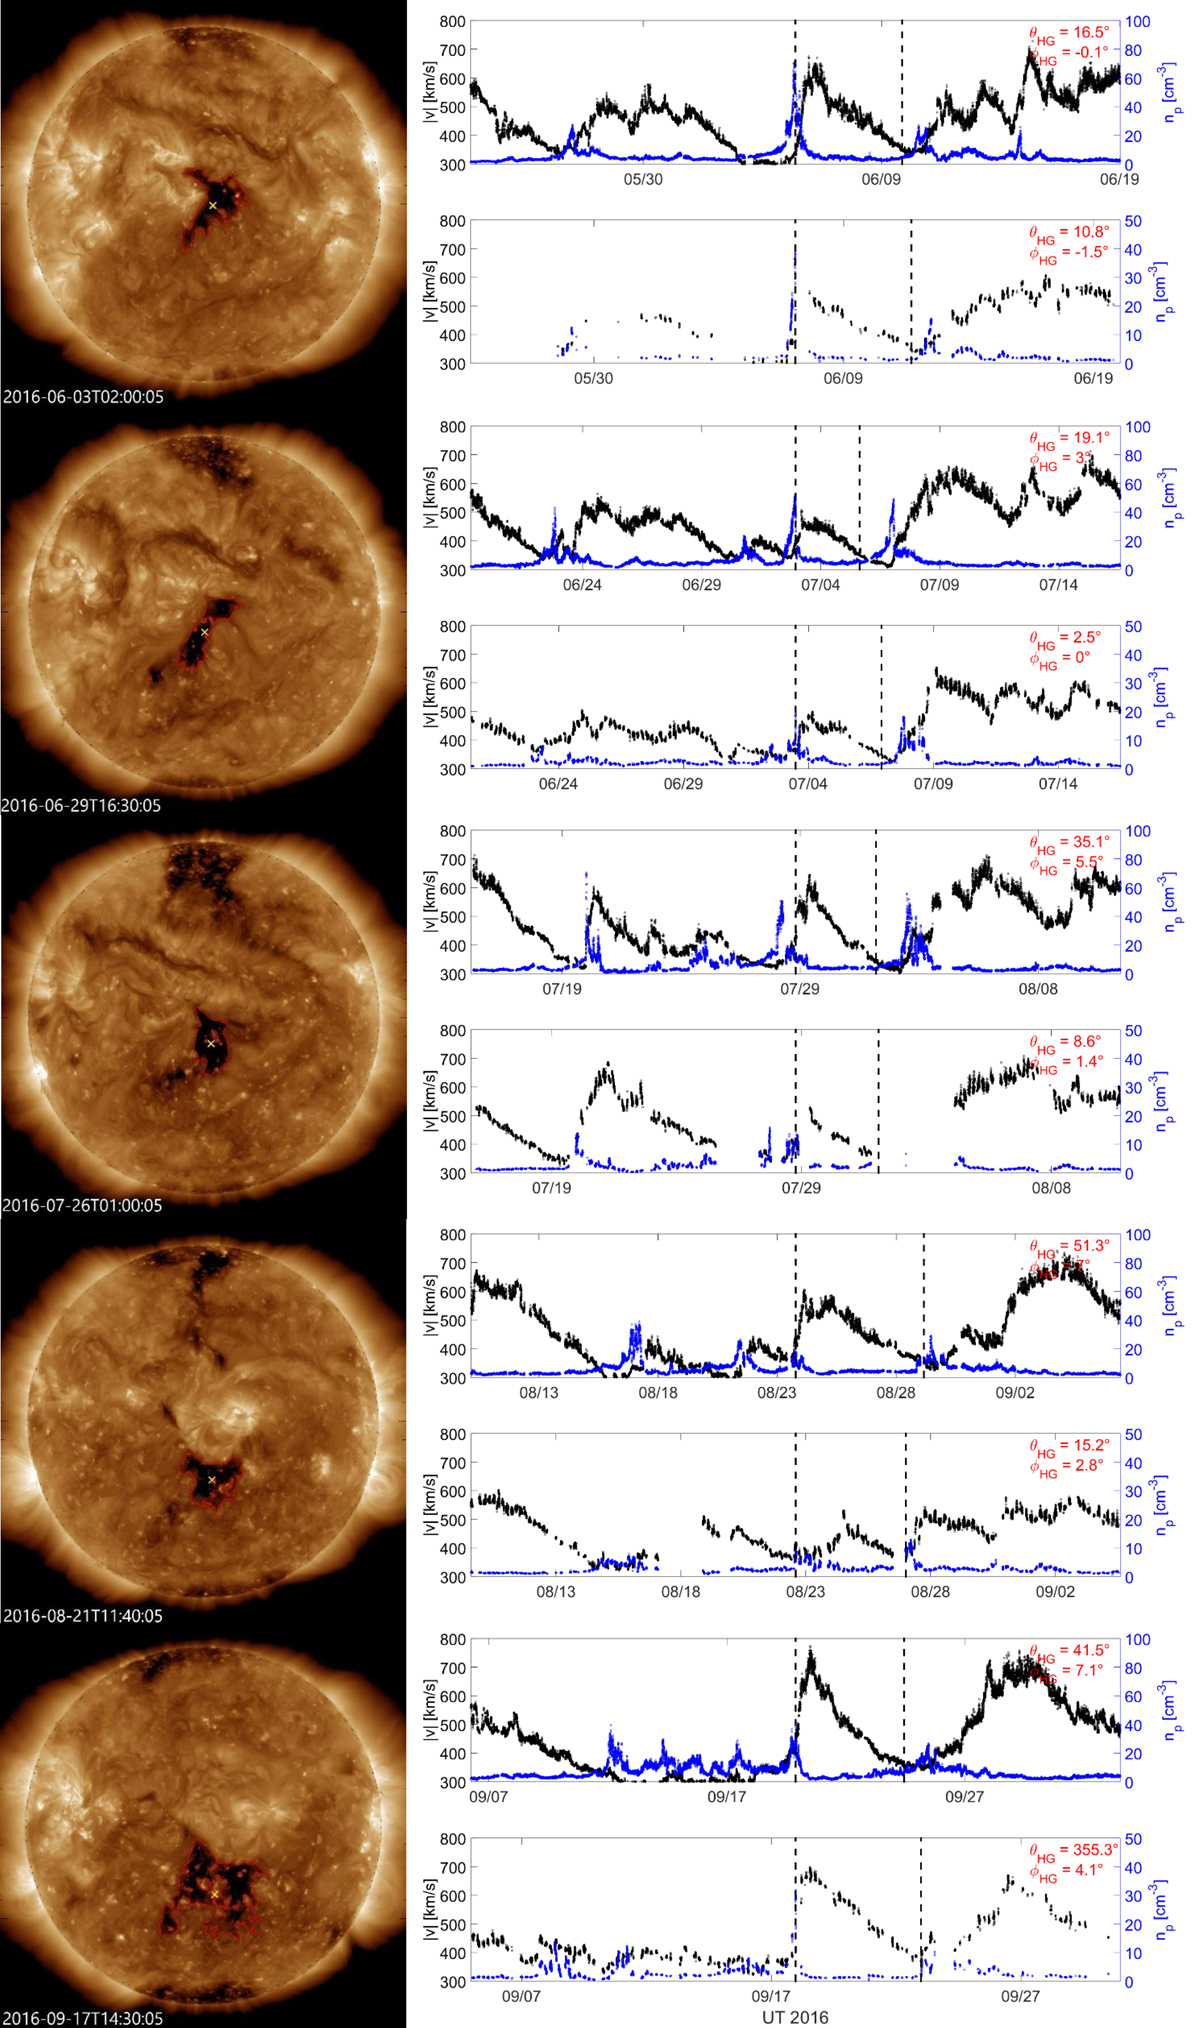
SDO/AIA 193 Å images and in situ SW plasma measurements for CIR no. 2 recurring five times. Left: EUV images showing CHs extracted via CATCH and identified as the origin of HSS measured in situ. Right: in situ SW bulk speed (red) and density (blue). The odd panels show SW data obtained from the OMNI database, the even panels depict MAVEN data. The density peak and the end time of the event are shown by the black dashed vertical lines. In the top right corner of the profiles the heliographic longitude ΘHG and the heliographic latitude ϕHG of the planet is given.
Current usage metrics show cumulative count of Article Views (full-text article views including HTML views, PDF and ePub downloads, according to the available data) and Abstracts Views on Vision4Press platform.
Data correspond to usage on the plateform after 2015. The current usage metrics is available 48-96 hours after online publication and is updated daily on week days.
Initial download of the metrics may take a while.