Fig. A.1.
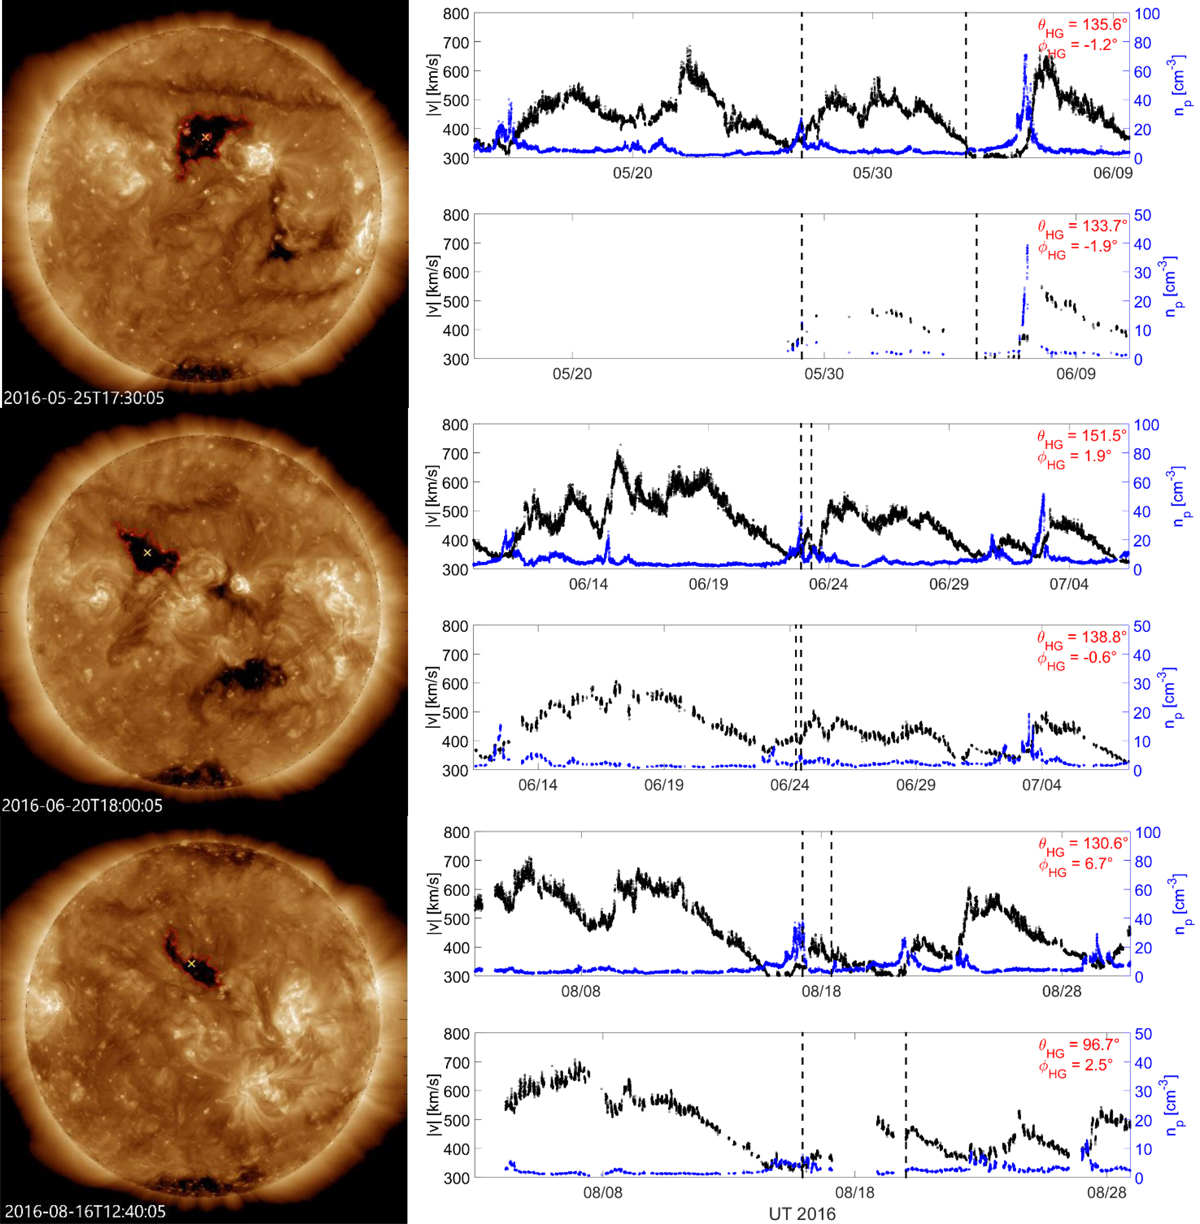
First corotating interaction region (CIR 1) that occurred during the opposition phase in 2016. Left panels: SDO/AIA 193 Å images of the source CH extracted using CATCH. The CH boundary determined via thresholding is given in red; a yellow x shows the geometrical center of mass. Right panels: in situ SW data showing proton number density (blue) and bulk speed (black) for one synodic rotation. The odd panels show SW data obtained from the OMNI database, the even panels depict MAVEN data. The heliographic coordinates of the planets at the time of SI passage are given in red in the upper right corner.
Current usage metrics show cumulative count of Article Views (full-text article views including HTML views, PDF and ePub downloads, according to the available data) and Abstracts Views on Vision4Press platform.
Data correspond to usage on the plateform after 2015. The current usage metrics is available 48-96 hours after online publication and is updated daily on week days.
Initial download of the metrics may take a while.