Fig. 8.
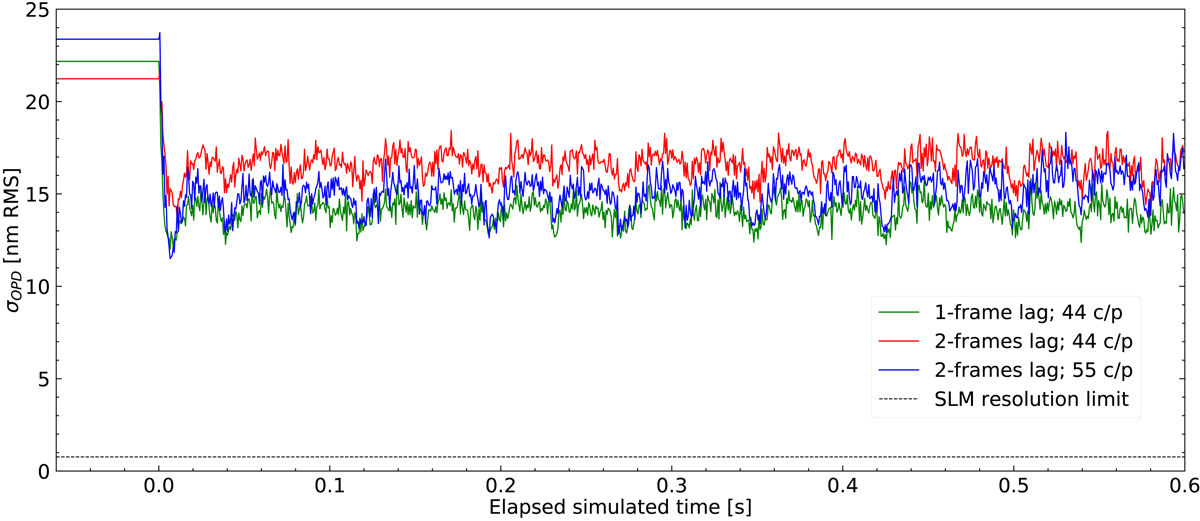
Evolution of the standard deviation in the OPD as a function of iteration when correcting VLT/SPHERE residual atmospheric turbulence with a wind speed of 10 m s−1 and an iteration lag of 0.67 ms for 0.6 s (1000 iterations). The green curve shows the case with a filter at 44 c/p and a one-frame lag, the red curve with a filter at 44 c/p and a two-frame lag, and the blue curve with a filter at 55 c/p and a two-frame lag. The correction loop starts at time 0.
Current usage metrics show cumulative count of Article Views (full-text article views including HTML views, PDF and ePub downloads, according to the available data) and Abstracts Views on Vision4Press platform.
Data correspond to usage on the plateform after 2015. The current usage metrics is available 48-96 hours after online publication and is updated daily on week days.
Initial download of the metrics may take a while.