Fig. 2.
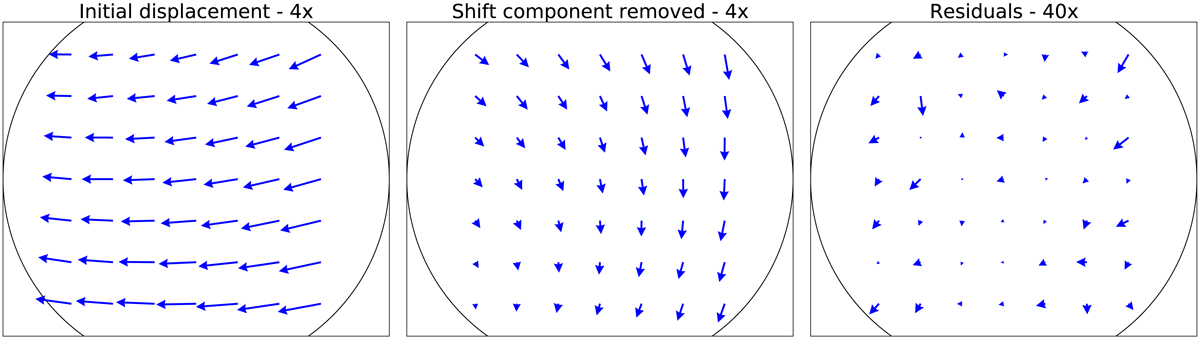
Geometrical distortion of the pupil between the SLM and the ZELDA WFS. Left plot: full pixel displacement between the introduced Gaussian spots and their measured positions, with a scale multiplied by four. Center plot: displacement after subtracting the C component, again with a scale multiplied by four. Right plot: final residual displacement after correction of the measured positions, this time with a scale multiplied by 40. The black circles represent the pupil footprint.
Current usage metrics show cumulative count of Article Views (full-text article views including HTML views, PDF and ePub downloads, according to the available data) and Abstracts Views on Vision4Press platform.
Data correspond to usage on the plateform after 2015. The current usage metrics is available 48-96 hours after online publication and is updated daily on week days.
Initial download of the metrics may take a while.