Fig. 11.
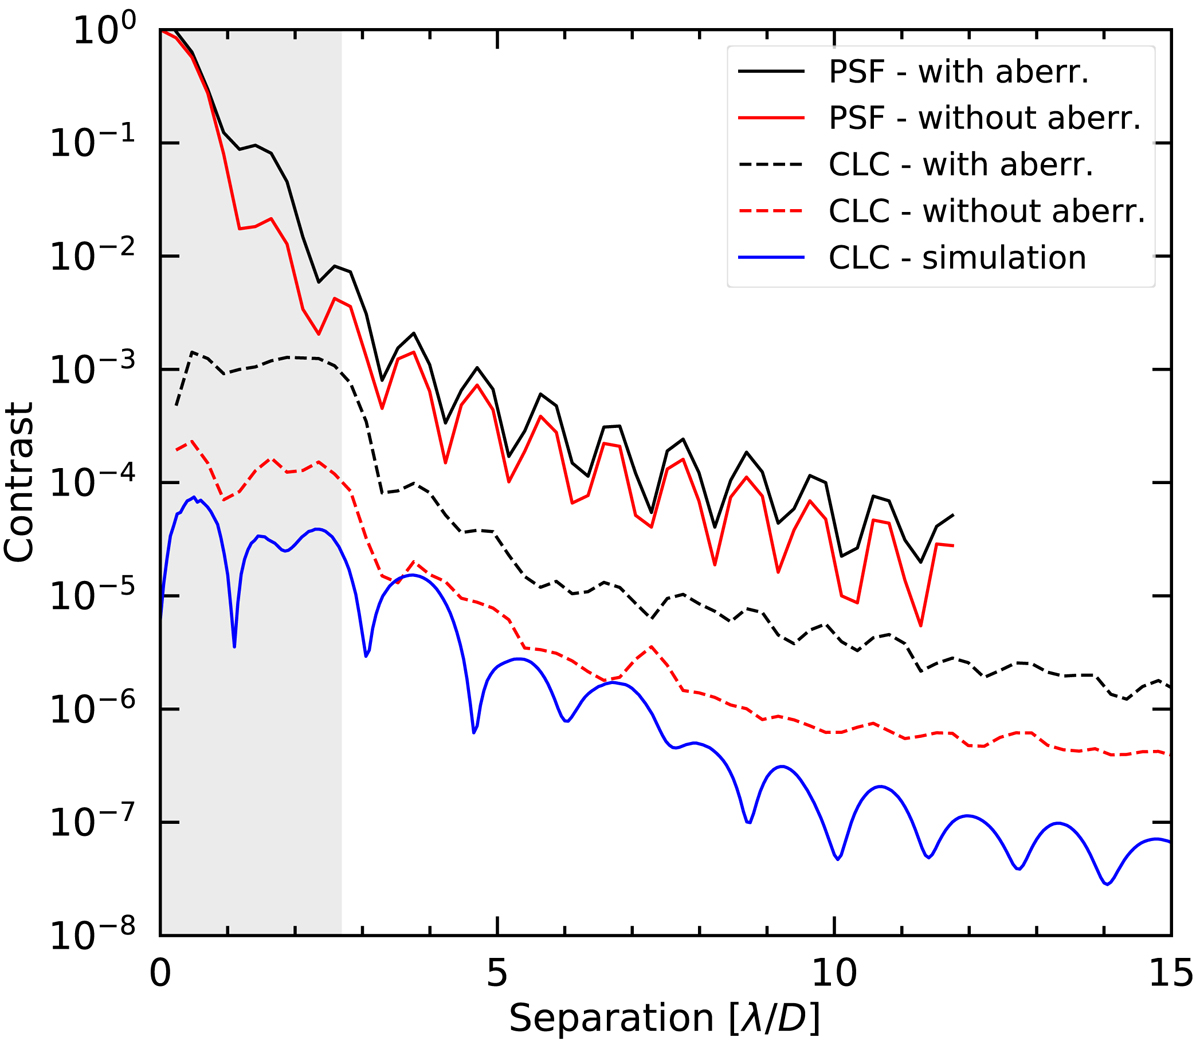
PSF and coronagraphic profiles before (black) and after (red) compensation of the bench aberrations. The profiles for the PSF and coronagraphic data are obtained with the azimuthal average and standard deviation of the images, respectively. The profiles are compared to the theoretical simulated profile (blue) obtained using as input an OPD map measurement with the bench aberration compensation prior to the coronagraphic measurement. The ghosts visible in Fig. 10 are masked when computing the profiles. The grayed out part of the plot corresponds to the area masked by the FPM in the coronagraphic images.
Current usage metrics show cumulative count of Article Views (full-text article views including HTML views, PDF and ePub downloads, according to the available data) and Abstracts Views on Vision4Press platform.
Data correspond to usage on the plateform after 2015. The current usage metrics is available 48-96 hours after online publication and is updated daily on week days.
Initial download of the metrics may take a while.